DataFam Roundup: July 19 - 23, 2021
Dig into the latest DataFam Roundup—a weekly blog that brings together community content all in one post. As always, we invite you to send us your content—and the DataFam content from your peers that have inspired you! Find the content submission form here.
DataFam content
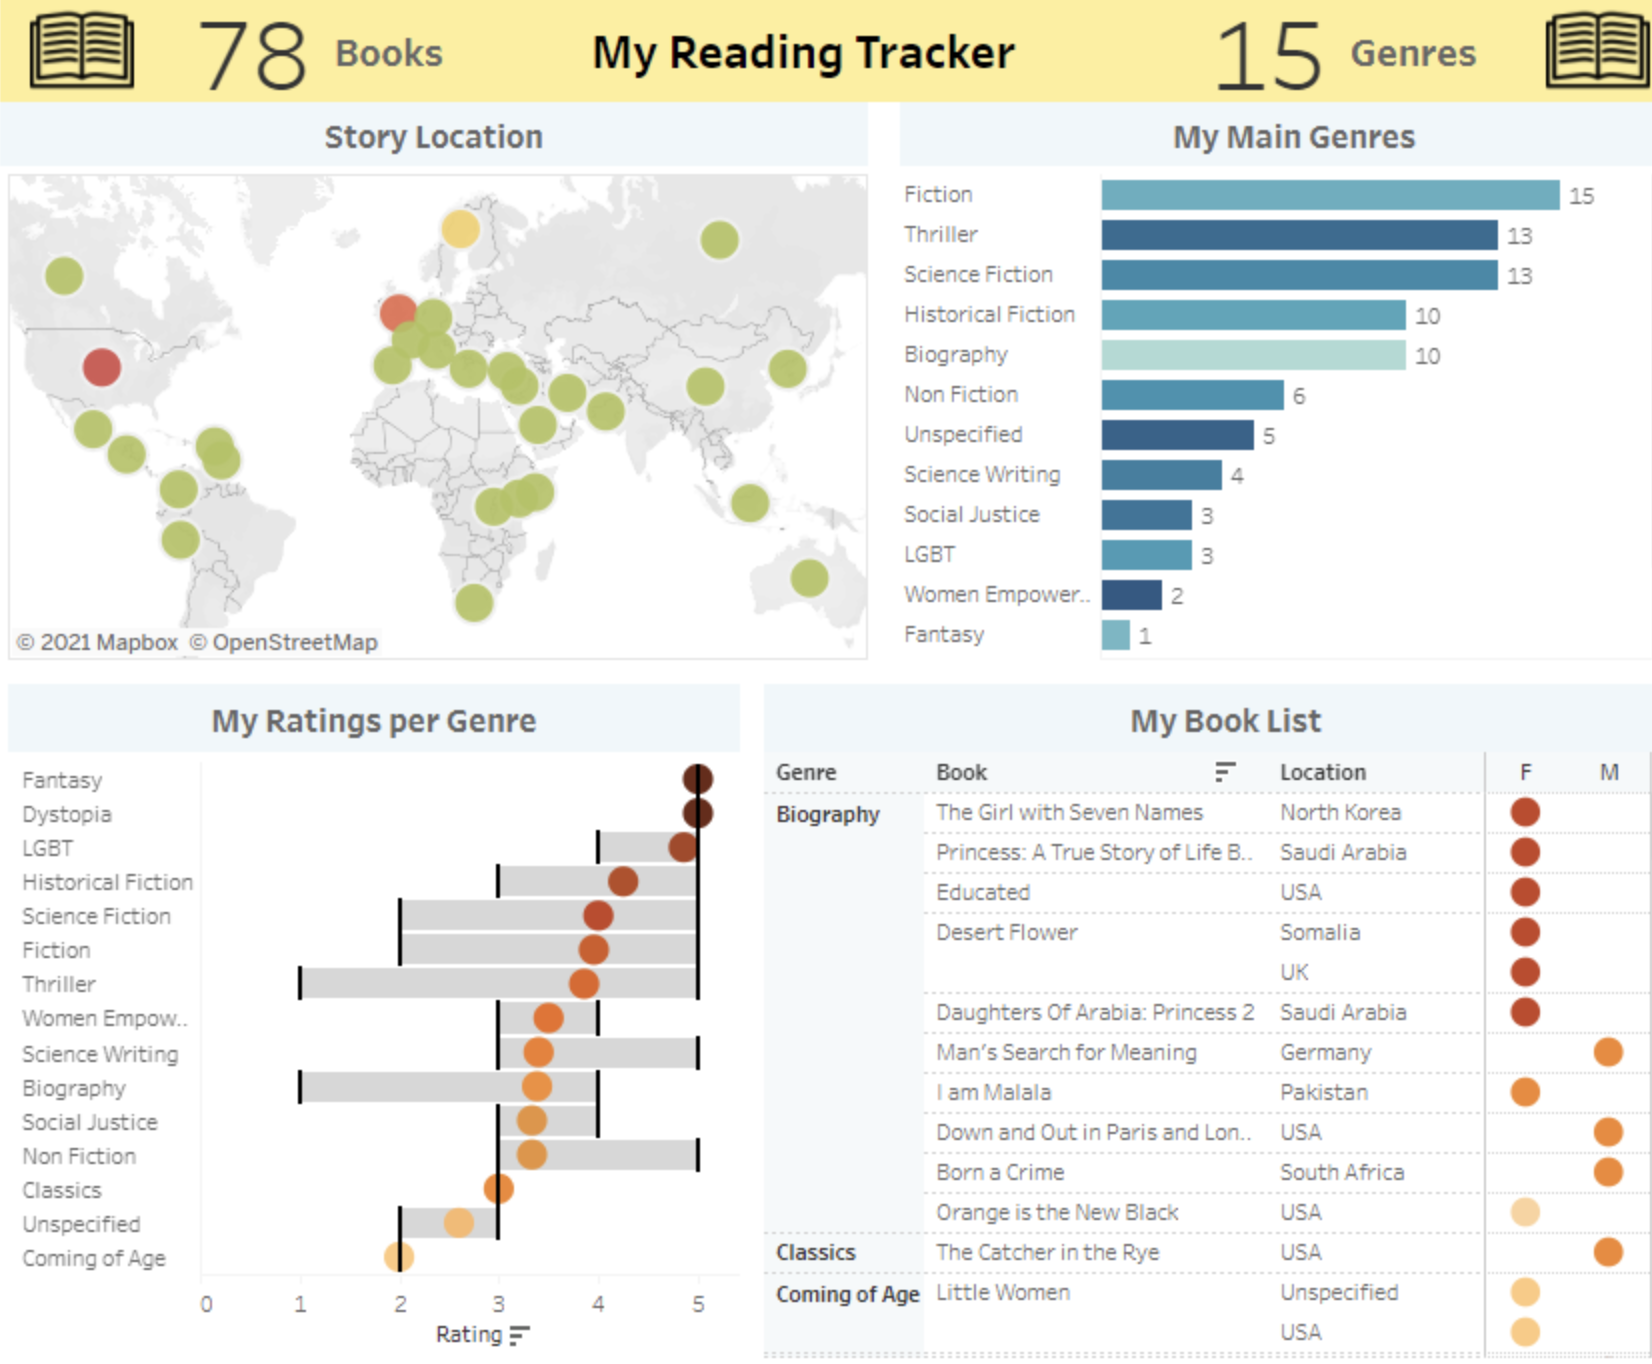
Ana Milana: Book Locations from Around the World
Dive into content created by the Tableau Community:
- Nancy Organ: An Incomplete Guide to Accessible Data Visualization
- Dilyana Bossenz, VizPilgrim: Viele Möglichkeiten Daten zu visualisieren/ Many possibilities to visualize data (German)
- Adam Mico: Big Announcements: My New Blog and Resuming DataFam Interviews (we need your help)
- Ana Milana: Book Locations from Around the World
- Ken Flerlage and Don Wise, The Flerlage Twins: Regex Part II: Basic Examples & Exercises
- Alan Murray, Tableau Academic: Ultimate guide to Tableau training and learning resources in 2021
- Ben Kiviti: #Tableau Tip of the Day
- Elliott Stam, Devyx: Publish Tableau workbooks connecting to published datasources using Python and the REST AP
- Alli Torban, featuring Amanda Makulec, Data Viz Today: Episode 65: Why You Don’t Need to be a Data Viz Unicorn to Have a Fulfilling Career
- JB Reyes, The Data School Australia: Map Drill Down Tutorial Using Set Actions And Container
- Robert Kosara, eagereyes: Chart Appreciation: Iraq's Bloody Toll by Simon Scarr
- Priyanka Dobhal: Unicode characters in Tableau
- Tableau Forums Ambassador Spotlight: Donna Coles
- Tableau Forums Ambassador Spotlight: Deepak Rai
- Tableau Forums Ambassador Spotlight: Diego Parker
- Tableau Forums Ambassador Spotlight: Graham Keller
- Tableau Forums Ambassador Spotlight: Mavis Liu
Upcoming events and community participation
- On July 27, as part of our Industries Week celebrating Team USA competing in the Tokyo Games, we’re highlighting the #SportsVizSunday monthly challenge. Watch as Zen Master and Social Ambassador Simon Beaumont creates a gold medal-winning visualization, from scratch, within 20 minutes. Or to put it another way, in less time than it takes to break the current 10,000 meters World Record! Enjoy expert viz commentary, an intro to Sports Viz Sunday, the Tableau Community, and Tableau Public━and decide if Simon’s viz is worthy of the top step on the podium. Register now.
- Join an upcoming Tableau User Group event by checking out all the virtual Tableau User Group events here
- Forums Unanswered Questions Blitz: For the month of July we are hosting a Blitz where we focus on tackling any Unanswered Questions in our Community.
Vizzes
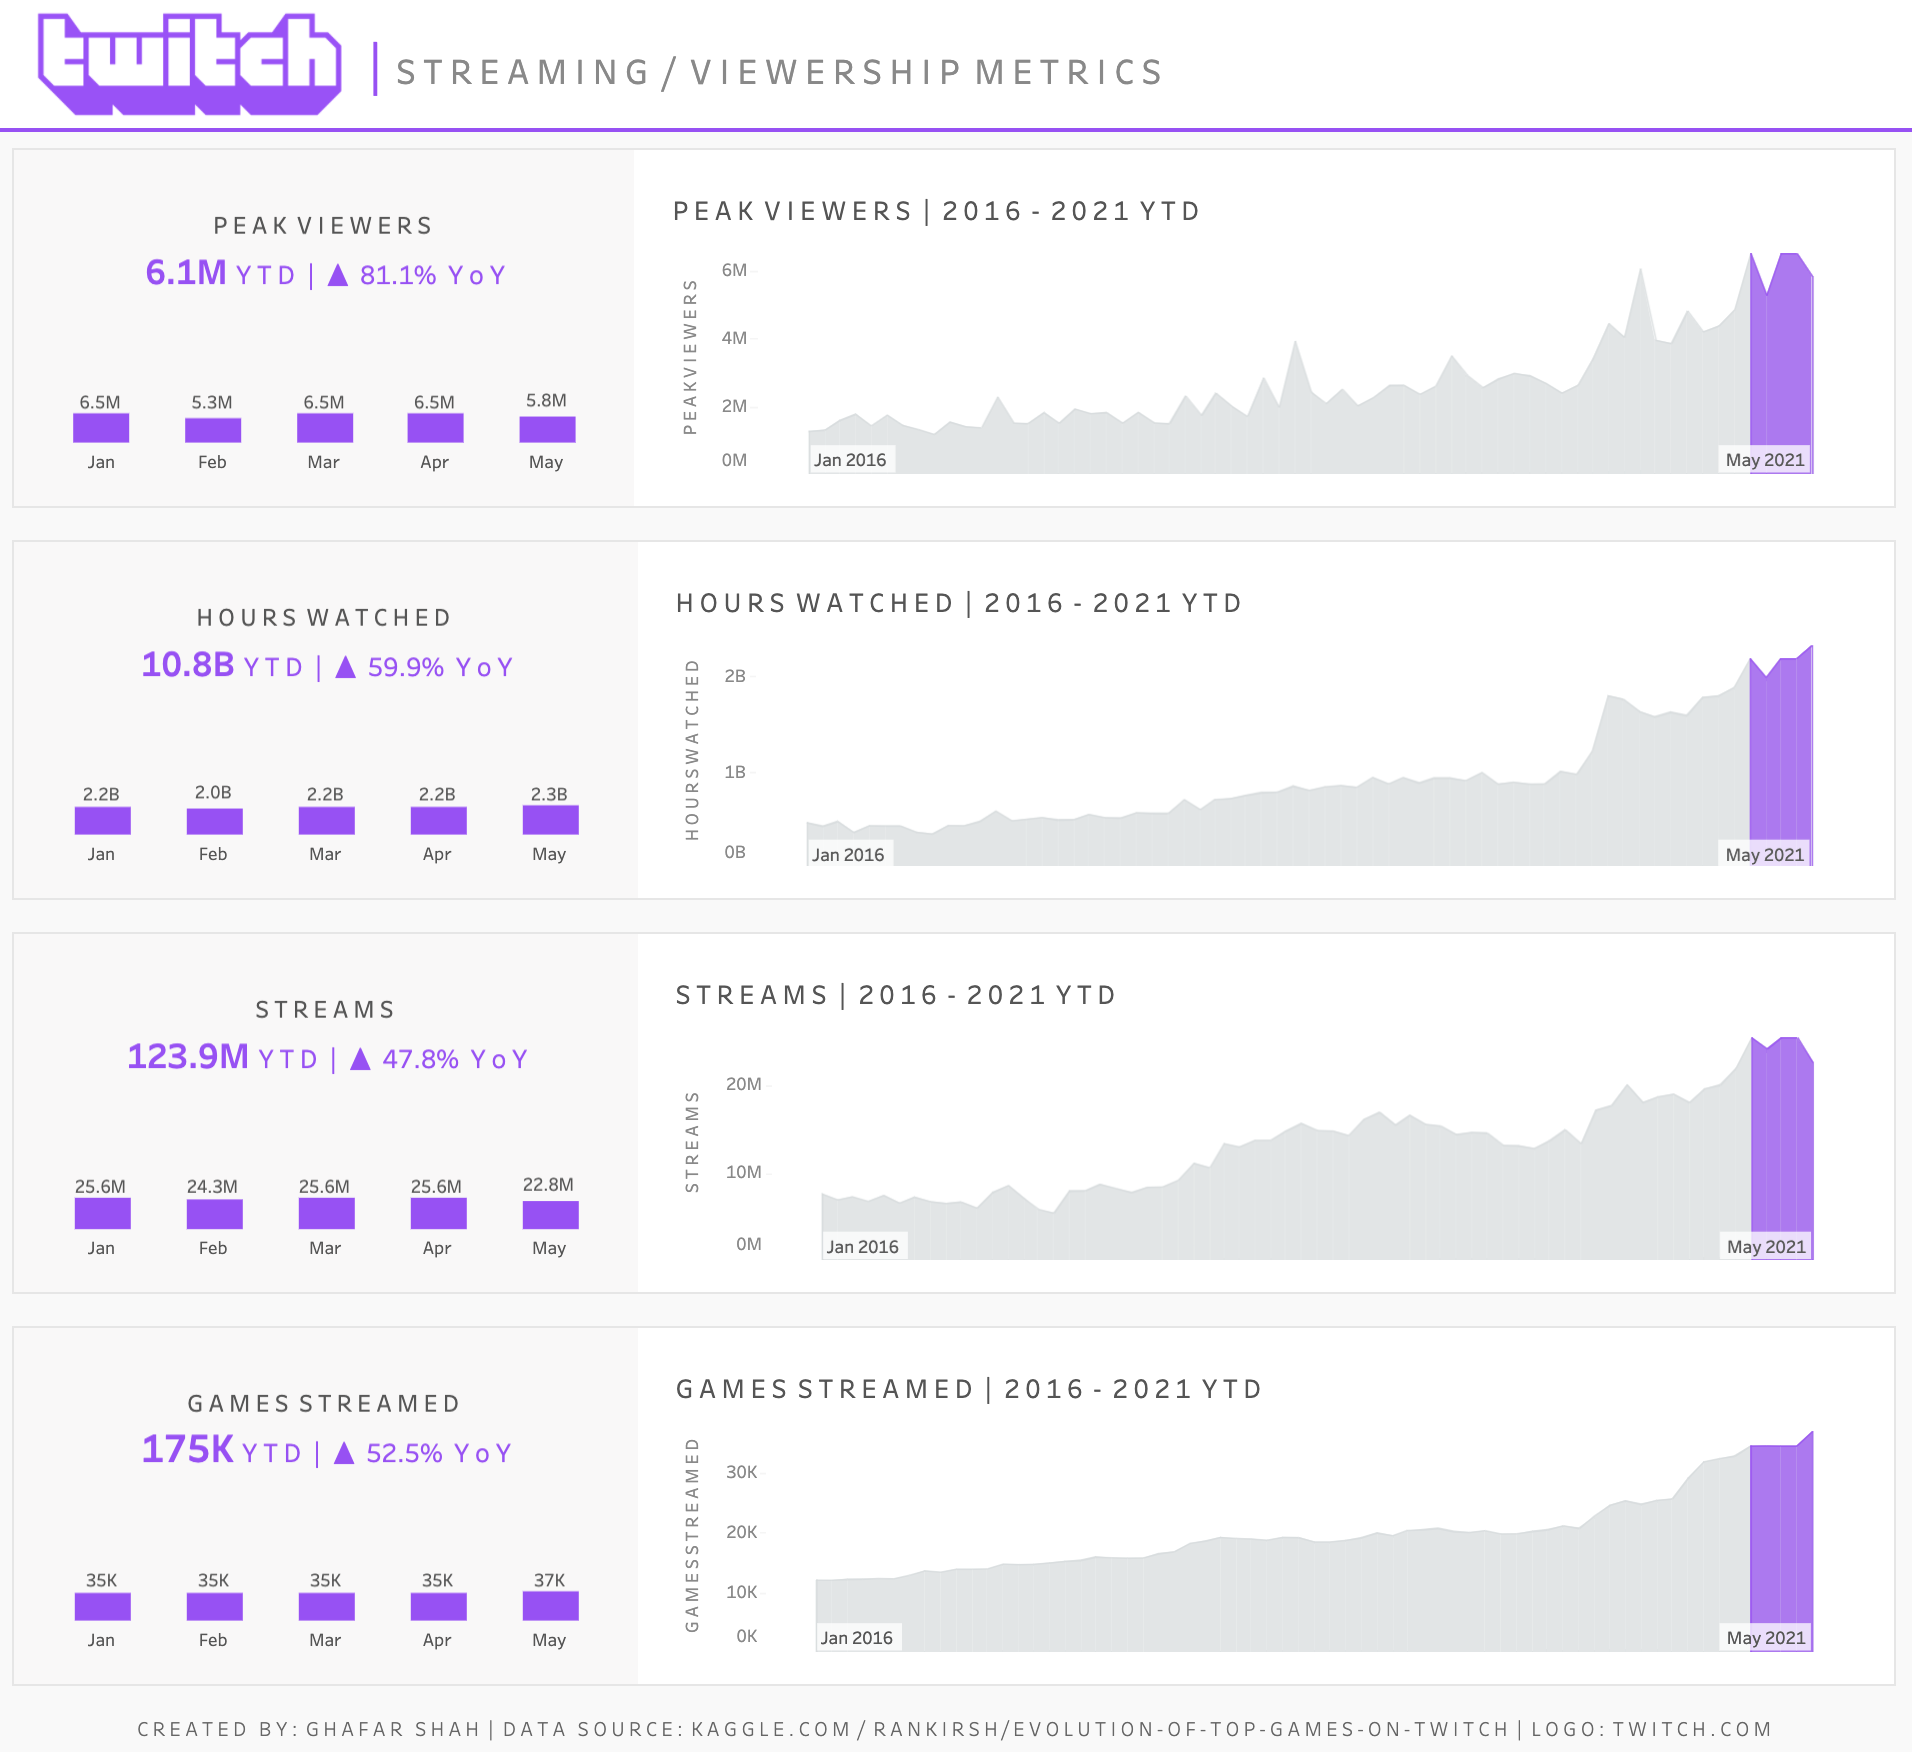
Ghafar Shah: Twitch | Business Dashboard
Catch this week’s Viz of the Days here and subscribe to get them emailed directly to your inbox.
Check out some inspirational vizzes created by the community:
-
Ghafar Shah: Twitch | Business Dashboard
-
Ant Pulley: Wot U Lookin' At?
-
Zak Geis: Custom Toolbar - Design Tip
-
Samuel Parsons: Tiled Collapsible Containers | 2021.2
-
Lilla Rasztik: Popular Youtube videos of Charlotte Dobre
-
Jeremy Johnson: Summer Olympics Medals 2000-2016
Makeover Monday
Join the community every Monday to work with a given data set and create better, more effective visualizations.
Web: Makeover Monday
Twitter: #MakeoverMonday
Week 29: Most minority ethnicities have a higher COVID-19 mortality rate
Workout Wednesday
Build your skills with a weekly challenge to re-create an interactive data visualization.
Web: Workout Wednesday
Twitter: #WOW2021
Week 29: Can you rebuild the Olympic Schedule?
Sports Viz Sunday
Create and share data visualizations using rich, sports-themed data sets in a monthly challenge.
Web: Sports Viz Sunday
Twitter: #SportsVizSunday
July 2021: The Olympics
Iron Quest
Practice data sourcing, preparation, and visualization skills in a themed monthly challenge.
Web: Iron Quest
Twitter: #IronQuest
Storytelling with Data
Practice data visualization and storytelling skills by participating in monthly challenges and exercises.
Web: Storytelling with Data
Twitter: #SWDChallenge
July 2021: exploring unit charts
Project Health Viz
Uncover new stories by visualizing healthcare data sets provided each month.
Web: Project Health Viz
Twitter: #ProjectHealthViz
SDG Viz Project
Visualize data about Sustainable Development Goals provided by the World Health Organization.
Web: SDG Viz Project
Twitter: #TheSDGVizProject
Goal 17: Partnerships for the Goals
Preppin' Data
A weekly challenge to help you learn to prepare data and use Tableau Prep.
Web: Preppin’ Data
Twitter: #PreppinData
Week 27: NBA Draft Lottery calculator
Real World Fake Data
Create business dashboards using provided data sets for various industries and departments.
Web: Real World Fake Data
Twitter: #RWFD
Dataset #12: Hospitality
Viz 2 Educate
Each month, create vizzes on global education syllabus topics as resources for teachers worldwide.
Web: Viz 2 Educate
Twitter: #Viz2educate
Topic: Microbiology
Diversity in Data
An initiative centered around diversity, equity & awareness by visualizing provided datasets each month.
Web: Diversity in Data
Twitter: #DiversityinData
June 2021: Pride Month
Viz for Social Good
Volunteer to design data visualizations that help nonprofits harness the power of data for social change.
Web: Viz for Social Good
Twitter: #VizforSocialGood


