TC network viz, getData() tutorial among best of the Tableau web
One of the best parts of Tableau Conference? It's you, says Chris DeMartini, and we couldn't agree more. You, our brilliant attendees, are a huge part of what makes TC so memorable each year.
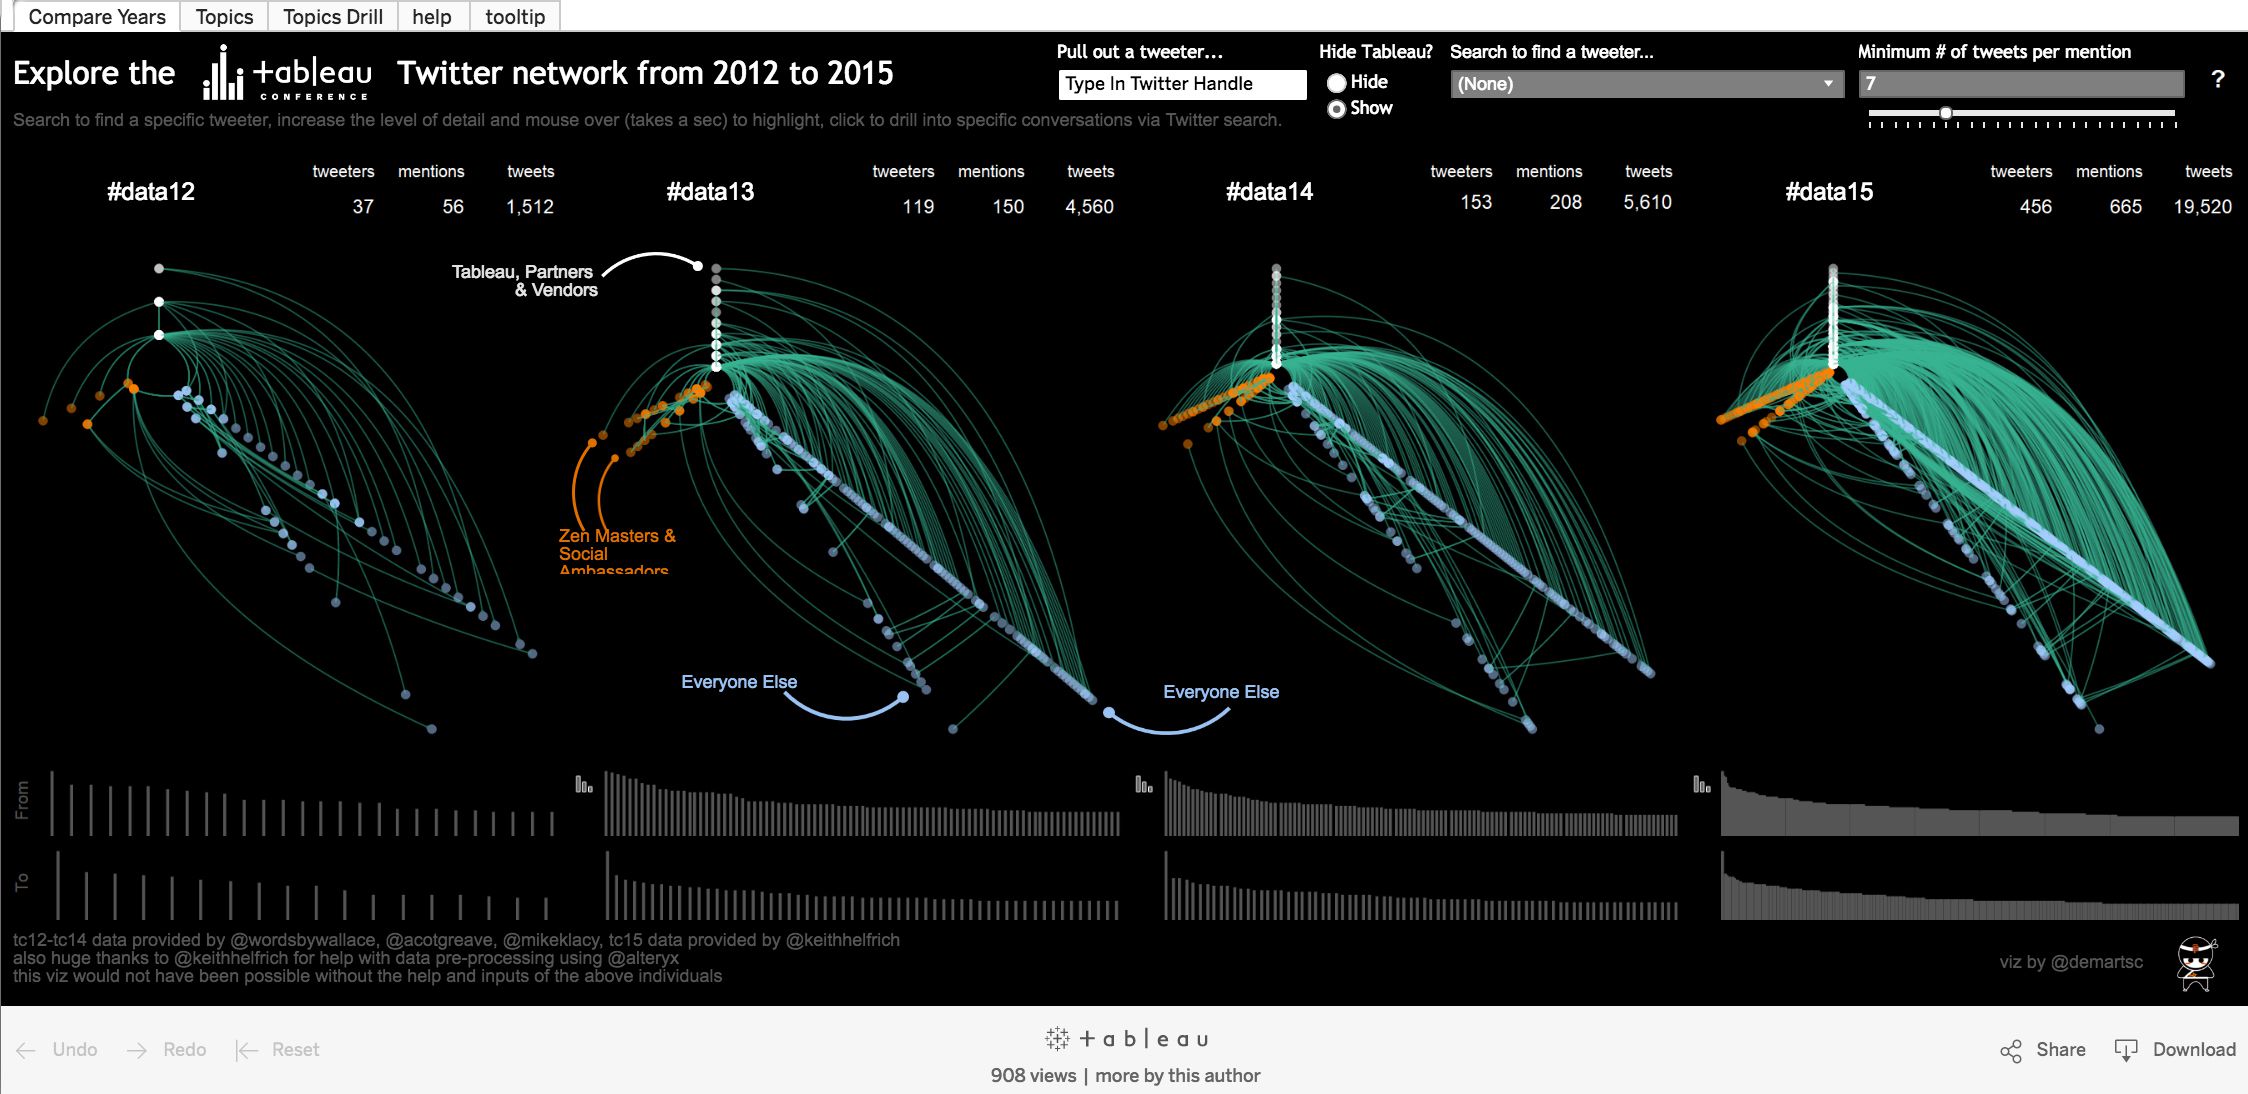
Chris collaborated with Keith Helfrich to each visualize the Twitter network of past years' attendees. Explore Chris's viz above, and see how Keith visualized the data. Notice the growth in numbers over the years. And drill down by tweeter or by conversation.
If you haven't yet, check out the schedule for TC16. This year's conference will feature absorbing keynote speakers like Bill Nye and Shankar Vedantam, hundreds of helpful sessions, and thousands of data explorers from around the world.
And here is the rest of the best of the Tableau web.
Tips and tricks
InterWorks I Gantt Believe It’s Not a Reference Line!
Data + Science Google Finance Data in Tableau 10 using Google Sheets Connection
Woman in Data Showing Nothing in Tableau When 'All' Selected
Vizible Difference Lookup by Association
Wannabe Data Rock Star How to Filter Data When You Don't Have the Data?
VizWiz How to Create a Two-Color Pareto Area Chart
The Data School Data Visualisation for (Not Quite) Noobs!: Nested Sorting Using the Rank Table Calculation
Tableau Server
Tableau Love Where Did the Admin View TWB Files Go in Tableau Server 10?
Databoss getData() Function in the New Tableau 10 JavaScript API
Dashboard design
Datasaurus Rex Saying No to Busy Vizzes
Data Revelations Spooning Skyscrapers! Maybe this Time You’ll See Why Bars Work Better than Donuts
Mobile design
Tableau Fit Tableau 10 Device Designer: Optimizing for Mobile & Getting Tableau to Fit
The Information Lab Taking Tableau Mobile: Focus on Your Message
Tableau Renders Designing Tableau Dashboards for Any Platform, Not Just Mobile
Do you blog about Tableau? Let us know in the comments below or via Twitter @tableau!
Autres sujets pertinents
Abonnez-vous à notre blog
Recevez toute l'actualité de Tableau.


