Toutes les histoires de
 Releases
Inside the Release: Tableau 2022.3 for Analysts and Business Users
 25 octobre, 2022
Learn what’s in Tableau 2022.3 for analysts and business users, including Data Guide, Table Extensions, Dynamic Zone Visibility, and more.
25 octobre, 2022
Learn what’s in Tableau 2022.3 for analysts and business users, including Data Guide, Table Extensions, Dynamic Zone Visibility, and more. Releases
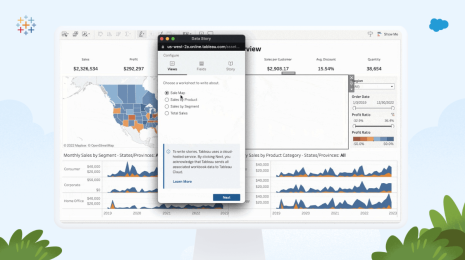
Disponible dans Tableau 2022.3 : Guide des données, extensions de tables, visibilité dynamique de zones et bien d'autres nouveautés
 19 octobre, 2022
Tableau 2022.3 propose de nouvelles fonctionnalités qui vous permettront de générer des insights à grande échelle, avec notamment le Guide des données, les extensions de tables, la visibilité dynamique de zones et bien plus.
19 octobre, 2022
Tableau 2022.3 propose de nouvelles fonctionnalités qui vous permettront de générer des insights à grande échelle, avec notamment le Guide des données, les extensions de tables, la visibilité dynamique de zones et bien plus.
 Visualizations
Exploring Spatial Relationships in Tableau
 13 octobre, 2022
Maps are a great tool to visually analyze spatial patterns. In Tableau, it’s simple to add multiple layers of data on top of a custom base map to easily see patterns.
13 octobre, 2022
Maps are a great tool to visually analyze spatial patterns. In Tableau, it’s simple to add multiple layers of data on top of a custom base map to easily see patterns. Iron Viz
Vous participez aux épreuves de qualification pour l'Iron Viz ? Voici comment vous pouvez gagner du temps !
 12 octobre, 2022
Des finalistes, participants et juges des éditions précédentes de l'Iron Viz expliquent comment optimiser votre temps et vous passer les qualifications haut la main.
12 octobre, 2022
Des finalistes, participants et juges des éditions précédentes de l'Iron Viz expliquent comment optimiser votre temps et vous passer les qualifications haut la main. Europe, Middle East, Africa
World Food Programme uses data to pivot to pandemic medical response
Pierre Guillaume Wielezynski describes how embedding Tableau dashboards into a new service marketplace enabled the World Food Programme to respond to Covid-19 Community Projects
What is the Tableau Community Project—Back to Viz Basics?
If you’re looking for a fun way to connect with data enthusiasts while also reinforcing foundational data visualization skills, Back to Viz Basics (B2VB)—a Tableau Community Project—is the perfect place to start. Tableau Public
Introduction à Tableau Public
 23 septembre, 2022
Guide complet pour bien démarrer votre parcours analytique.
23 septembre, 2022
Guide complet pour bien démarrer votre parcours analytique.
Data Analytics: The Key to Unlocking the Retail Advantage
Data analytics provides retailers with a strong business advantage
 Tableau Community
What is a Data Viz Competition?
 13 septembre, 2022
Learn about the key elements that make up a Viz Game, or data visualization competition, in which contestants show off their design, analytics, and data storytelling skills.
13 septembre, 2022
Learn about the key elements that make up a Viz Game, or data visualization competition, in which contestants show off their design, analytics, and data storytelling skills. Partners
3 Tips from Deloitte on Leading a Data Viz Competition with Diversity, Equity and Inclusion
Drawing on the Tableau Iron Viz format, Deloitte’s Viz Games annual data visualization competition helps improve data literacy and strengthen data culture across their organization. Learn three tips on leading a data viz competition at your work—and see the winning vizzes from the teams at Deloitte. Community Profiles
Learning Tableau Helped Me Land My Dream Job in the Music Tech Industry
 23 août, 2022
Abonnez-vous à notre blog
Recevez toute l'actualité de Tableau.