Uncover patterns in your data with Tableau 10’s clustering feature
Complex data can make these questions tough to answer even when you have distinct and well-separated groups. Plus the data is sometimes distributed in such a way that it contains no obvious gaps to distinguish groups via manual inspection. The good news: This process just got much easier in Tableau 10. The new clustering feature automatically groups together similar data points.
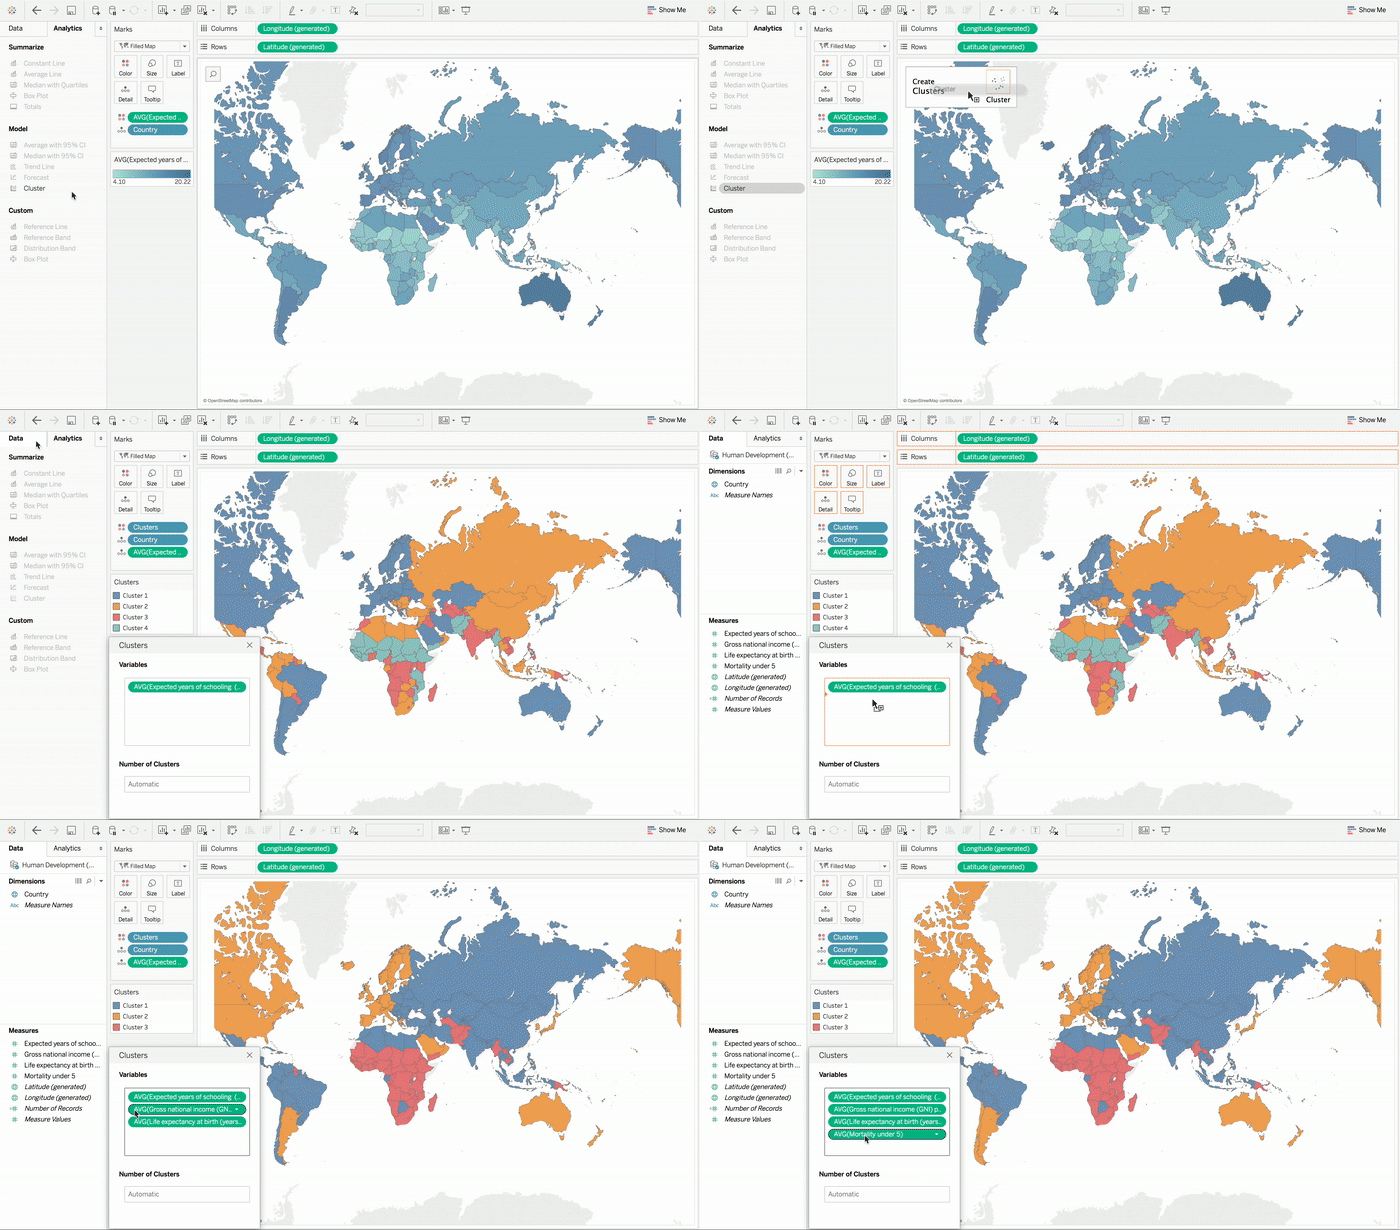
Update: Tableau 10 is here! Download now to try out the feature outlined below. Say you’ve got sales data. Wouldn't it be great to uncover distinct groups in your customer base and develop targeted marketing programs? Or maybe you’re in healthcare. Wouldn’t you like to identify patients who’ve had similar symptoms when investigating effectiveness of treatments? Complex data can make these questions tough to answer even when you have distinct and well-separated groups. Plus the data is sometimes distributed in such a way that it contains no obvious gaps to distinguish groups via manual inspection. The good news: This process just got much easier in Tableau 10. The new clustering feature automatically groups together similar data points. You can use clustering on any type of visualization you’d like, from scatter plots to text tables and even maps. If you’re looking for clusters in your sheet, just drag clustering from the Analytics pane into the view. To see how different inputs change clustering results, you can experiment by dragging them in and out of the dialog and seeing the results in real-time.  Tableau also recommends the number of splits, which is very handy if you’re exploring your data set to see if there are groupings. Of course, you can also specify the number of clusters you’d like to get. For example, if you’re analyzing which combination of your products your customers buy to see what kind of bundle offers makes sense, you may want to split your data into a number of bundles you’re considering. This is, in a way, similar to the concept of creating bins in Tableau, but it can cut across multiple fields with varying bin sizes. In the example below, you can see the results of clustering countries based on data from the United Nations.
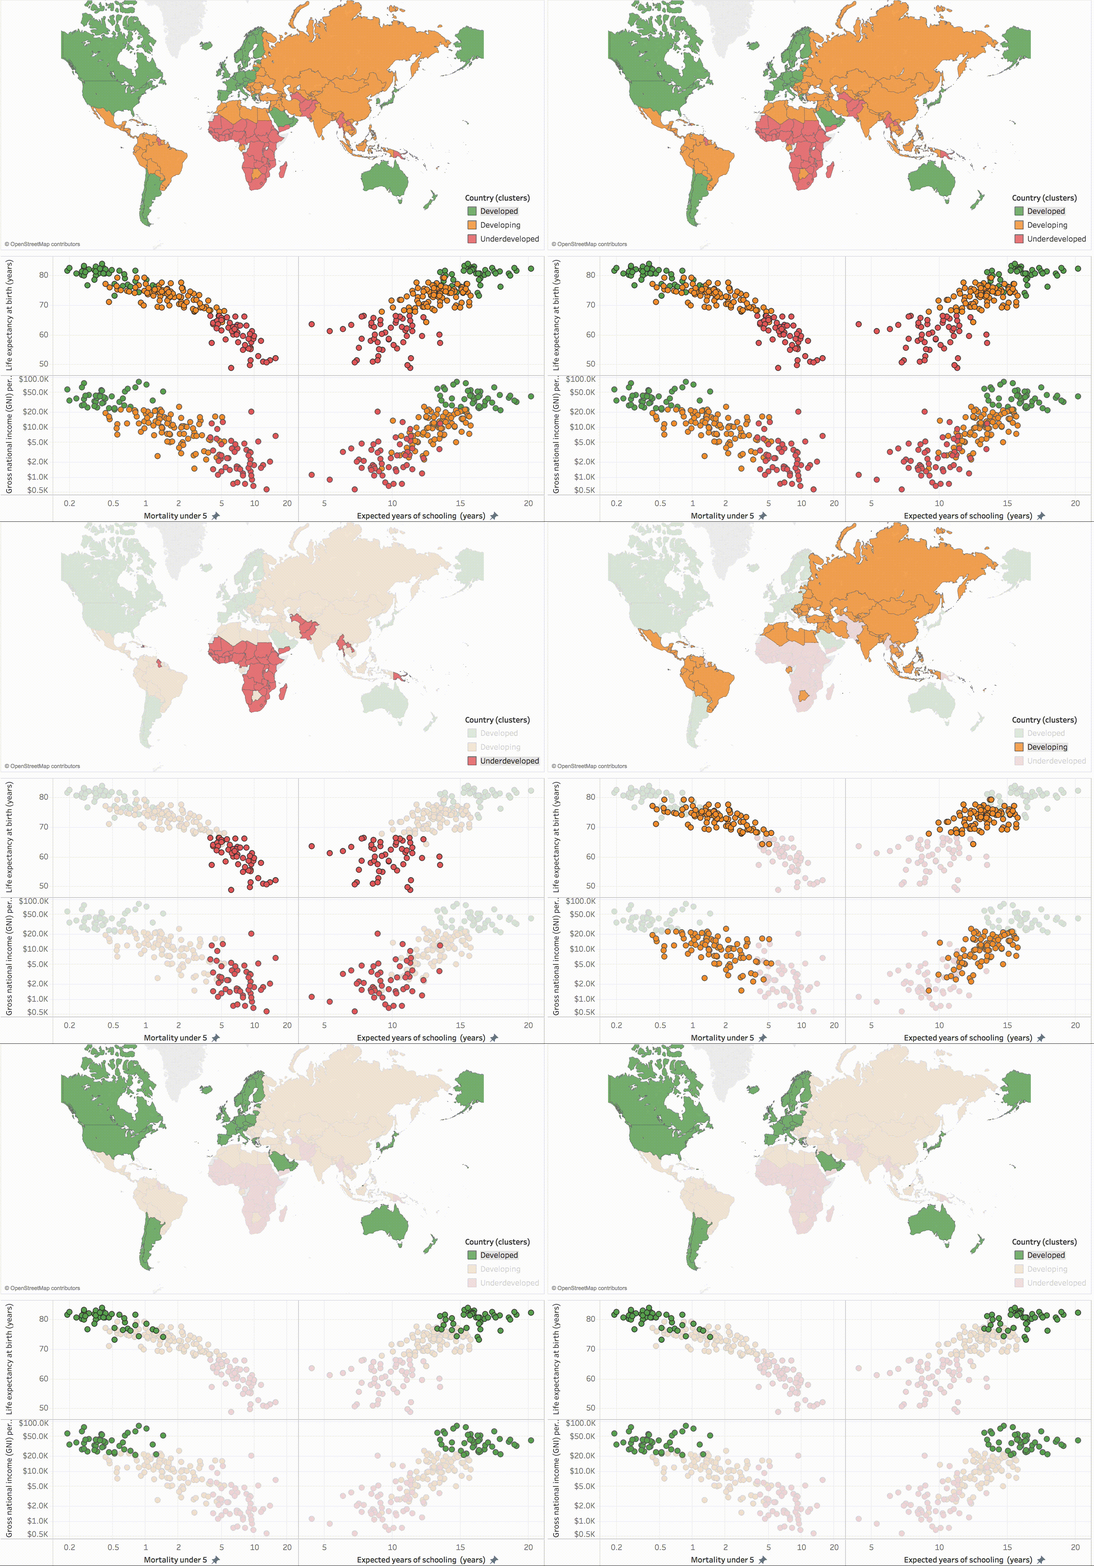
  Once you identify the clusters, you can assign them more intuitive names based on the summaries for each cluster (which, in this case, can be seen in the scatter plots). In this example, we have three clusters corresponding to developed, developing, and underdeveloped countries based on the four metrics used as the clustering criteria. You can use clustering results in other visualizations like dimensions. You can even manually override cluster assignments if you have external domain knowledge that you want to incorporate into the results. For example, you might be clustering neighborhoods based on demographics data. But maybe you want clusters to be geographically contiguous due to a business requirement driven by external factors like truck-delivery routes or local advertising deals. To do this, simply start by dragging the cluster pill from the sheet into the data pane on the left to save the results. You can edit the resulting field as a group and use it anywhere in Tableau just like any other group. Tableau uses the k-means clustering algorithm with a variance-based partitioning method that ensures consistency between runs. It goes through automatic preprocessing steps to reduce data preparation needed for this type of analysis. These include standardization of inputs that automatically scales the data and multiple correspondence analysis. (If you’re curious about the details, you can find out more about the math behind clustering in our product documentation.) This means you can work with many different types of data with minimal preparation. You can include categorical fields like “education level” in your clustering analysis alongside numeric variables like “income” without worries or use it for clustering survey responses where all inputs could be categorical. Whether you are exploring patterns in genomic data, looking for similar neighborhoods using census data, or analyzing your customers’ loyalty-card usage, clustering can help you better understand your data.
Join the beta
We’re thrilled to bring you these new features, and we’d love your input. We have a timeline for getting Tableau 10 out the door, but we’d first like to get solid usage in beta and fix any bugs. Please join the beta program and let us know what you think.
Learn more about Tableau 10
Tableau 10 includes a brand new look and feel, and a host of new features to help you prep, analyze, and share your insights even faster. Check out our Coming Soon page for details.
Answers through analytics
- Quickly find marks in context with Tableau 10's new highlighter
- Build your own custom territories in Tableau 10
- Do more with bar charts in Tableau 10
- Tableau 10 includes more maps data, multilingual auto detection
Data breakthroughs
- Integrate your data with cross-database joins in Tableau 10
- As requested, you can filter across data sources in Tableau 10
- Do more with APIs in Tableau 10
- Tableau 10 includes even more data-source options
- Connect directly to Google Sheets in Tableau 10
- (Finally!) see and understand your IoT data with our Google Sheets connector
- Connect directly to your QuickBooks online data in Tableau 10
- Favorite your data sources in Tableau 10
Beautiful by design
- Check out the beautiful look and feel of Tableau 10
- Format your workbook with just a few clicks in Tableau 10
- How we designed the new color palettes
- Tableau 10 includes a new typeface designed for data
Delightfully mobile
- Design dashboards that shine on any device in Tableau 10
- Tips for designing device-specific dashboards that make everyone happy
- Manage your Tableau Mobile deployment with AirWatch or MobileIron
Do more on the web
- Author dashboards from scratch on the web in Tableau 10
- Do more while publishing workbooks in Tableau 10
- See a history of your revisions in Tableau 10
- What's new in Tableau Online
Self-service at scale
- Check out the new enterprise features in Tableau 10
- Extract-refresh fail? Get an email alert in Tableau 10
- Subscribe others to your views and workbooks in Tableau 10
Beta
Articles sur des sujets connexes
Abonnez-vous à notre blog
Obtenez les dernières nouvelles de Tableau dans votre boîte de réception.


