Transition to the new COVID-19 dataset—without rebuilding your whole workbook
This last week, you may have gone to update your Tableau Public workbook with the latest COVID-19 data and were surprised to get a warning message stating “The worksheet… contains errors.” If you clicked through the subsequent messages that fields will be removed, when Tableau loaded your dashboard you might have been dismayed that all your sheets were greyed out. Maybe you clicked into a sheet and found it screaming with errors, like this:

Oh no! What is going on?
Don’t worry: It’s not you—it’s us. Over the weekend, Tableau deprecated the COVID-19 Case data that you built your workbook from. When you opened your workbook this time, you were automatically connected to the new COVID-19 Activities data source instead. The COVID-19 Activities data source is sourced from a different entity than the Case data source, and is structured slightly differently with different field names. Tableau is looking for the field names you used to build your visualization, and then spazzing out because it can’t find them. If you’re curious, the changes between the data sources are outlined in detail in this blog post.
Maybe you caught the word “deprecated” and are panicking—and we get it. Nobody wants to have to rebuild their workbook from scratch. The good news is you likely won’t have to. In this blog post, we are going to walk you through step by step how to move your workbook to the new data source while minimizing the amount of work required.
For this activity, the images will be using an older version of the Covid-19 Starter Workbook that has not yet been updated to the new data source. But this process should work in much the same way if you have modified the starter or you have created an original workbook off the JHU data set and want to use that instead. This isn’t a long process, but we recommend being able to devote about 20-30 minutes.
First, we need to bring the new data source into our workbook. Although we are not going to use it right away, I find it helpful to take a look at the end result you’ll be aiming for.
Step 1: To begin, download the Covid-19 Activites file from data.world to your local computer.
Step 2: Next we need to add this data source to the workbook. Open the workbook you want to update, the version still pointing to COVID-19 Cases.
Step 3: Connect to the COVID-19 Activities file by selecting Data > New Data Source from the menu bar. From the list of connectors select “More…” if you are using the Hyper version of the file or “Text file” if you are using the CSV.
Step 4: You should now have two data connections in your workbook. COVID-19 Activities (new) and COVID-19 Cases (old).
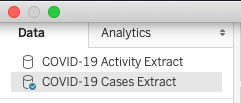
Step 5: Next, we’re going to modify the existing data source built on COVID-19 Cases to more closely resemble the new COVID-19 Activities data source. This will enable Tableau to automatically match and replace the majority of the fields when the time comes to switch data sources.
To organize this process, first hide all unused fields by clicking the caret at the top of the dimension pane and Hide All Unused Fields. This will remove any clutter of fields that are not being used in your workbook.
Step 6: The next step is to Alias the field names in the dimension and measure to match across the data sources. Go to the Data Source pane (click on the button on the bottom right corner) and change to the list view. Select the drop down on the row  and select Rename. The primary fields from the data source are highlighted in Blue.

If you have previously renamed any of the fields, you will see the original name listed under Remote Field Name.
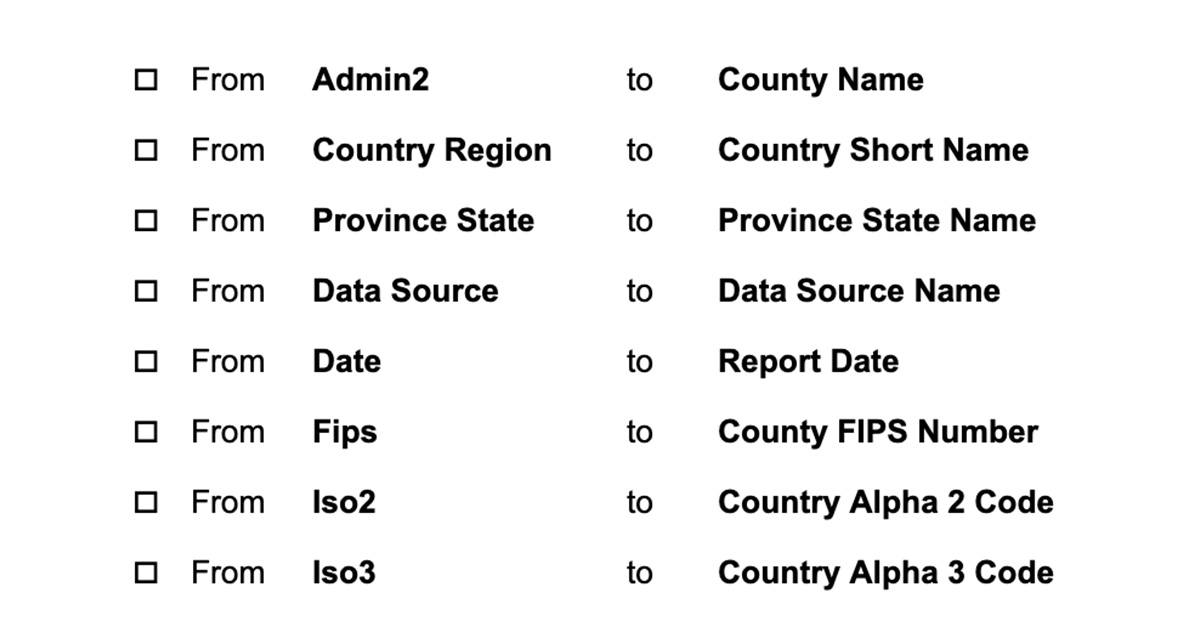
Once you’ve renamed all the fields, switch back to the sheet view by clicking on any open sheet.
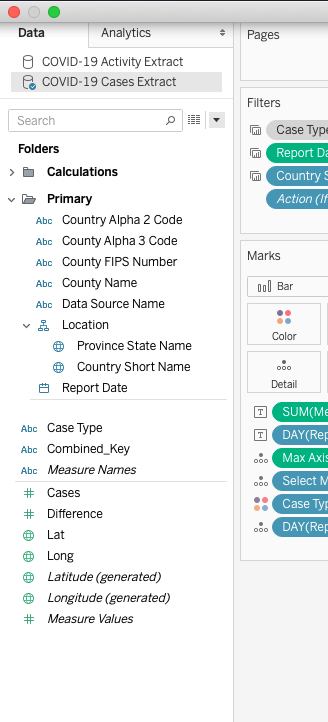
Step 7: We’re going to use Folders to organize our dimensions and measure. To activate this, right click on any dimension name and select Group By > Folder. Create a folder by right clicking on the field ‘County Name’ and select Folder > Create Folder… name it ‘Primary’ click OK.
Now, drag and drop all the above fields into the Primary folder you created. Your workbook should be laid out like this (note this screenshot is from version 2020.2).
Step 8: Next, we are going to do a similar action to folder all the calculations. Select all fields that are calculations by holding down the Control key as you select them with your mouse. Right click and select Folders > Create Folder… call this folder ‘Calculations’ and click OK.
If you collapse your calculations folder, your view should look like this…
Step 9: Now, we need to mimic the unpivoted structure of the new data set. We will do this by creating four new calculations. If you’ve already created these in your workbook previously, you can rename the calculations as you did in Step 1 above. There is no need to recreate them. Create a third folder called ‘New Measures’ and add these calculations to it.
- People Positive Cases Count
IF [Case Type] = ”Confirmed” THEN [Cases] END - People Positive New Cases Count
IF [Case Type] = ”Confirmed” THEN [Difference] END - People Death Count
IF [Case Type] = ”Deaths” THEN [Cases] END - People New Death Count
IF [Case Type] = ”Deaths” THEN [Difference] END
Step 10: We want to find and replace everywhere the following fields (Case Type, Cases, Difference) are used in combination with the correct calculation above. There is no easy way to do this, and I recommend as a rule you should first work through the fields in the Calculations folder then, move through sheets.
When you’ve finished checking and updating each calculation, right click on the calculation, select copy, and then select the COVID-19 Activities data source and paste the calculation here. This is a really critical step, so don’t skip it. If you want you can replicate the folder structure.
Step 11: Once you’ve searched through all the calculations, it is time to check all the sheets. This step is the most time consuming. You know you’ve been 100% successful with this, when you right click on a dimension or measure and Hide is no longer greyed out. Having said that, do not worry if some elude you as it will become clear when you swap the data sources where they are still hiding. The goal here is to do a lion share of the work now.
A couple tips:
- To begin, go through your dashboards and unhide all sheets. Don’t forget to unhide any vizzes in tooltips that have been previously hidden.
- When you’re replacing Cases or Differences, directly drop the pill for the new measure on top of the old pill. This will retain much of your formatting.
- Remember to check every Marks Card and Filter Shelf in addition to columns and rows.
- If you are using Case Type on the Marks card, particularly for Color, using Measure Names instead often can often mimic the same experience.
- When you have validated that the sheet doesn’t have any of the three problematic fields, change the sheet color to green. This enables you to switch to the Sheet Sorter View and easily see how much progress you’ve made.
Here are some before/after examples of how you might need to rearrange the pills to achieve the same viz with the new structure:
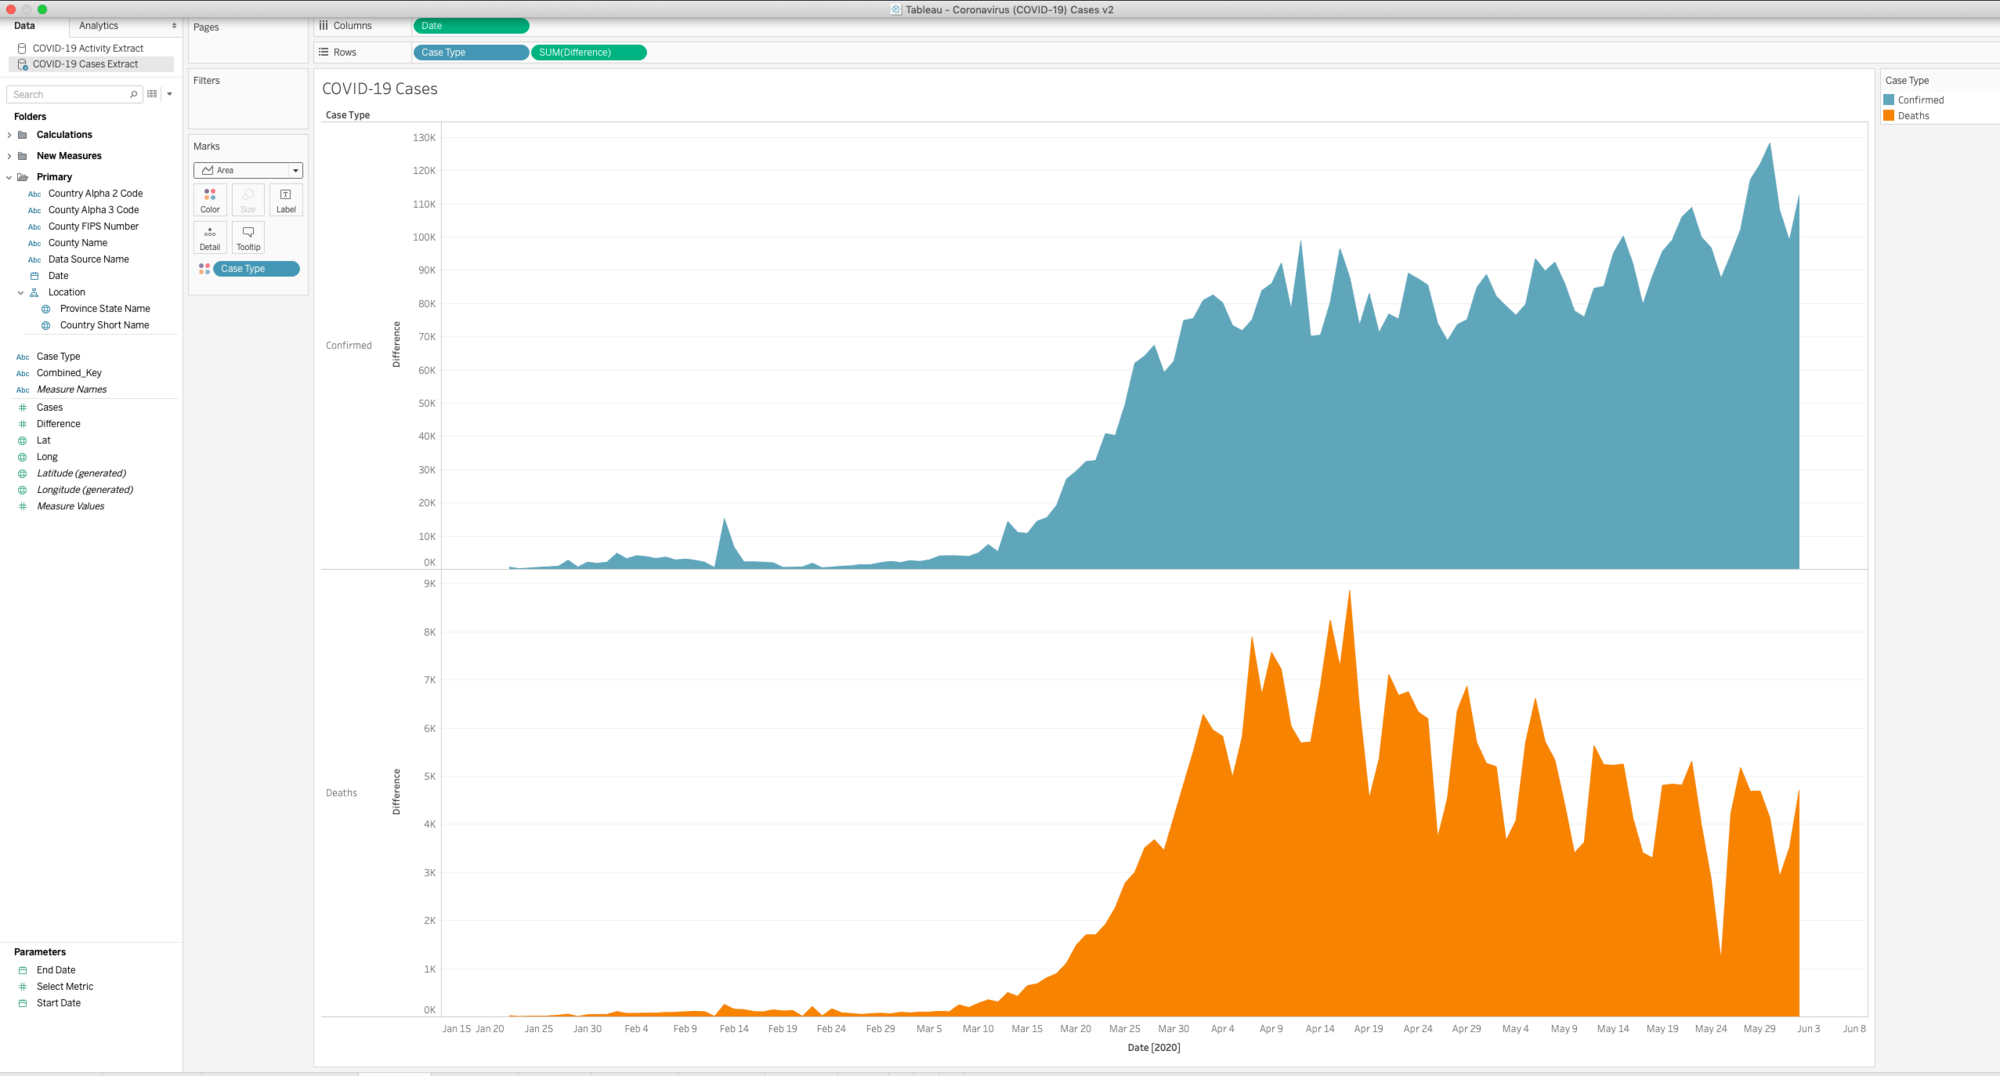
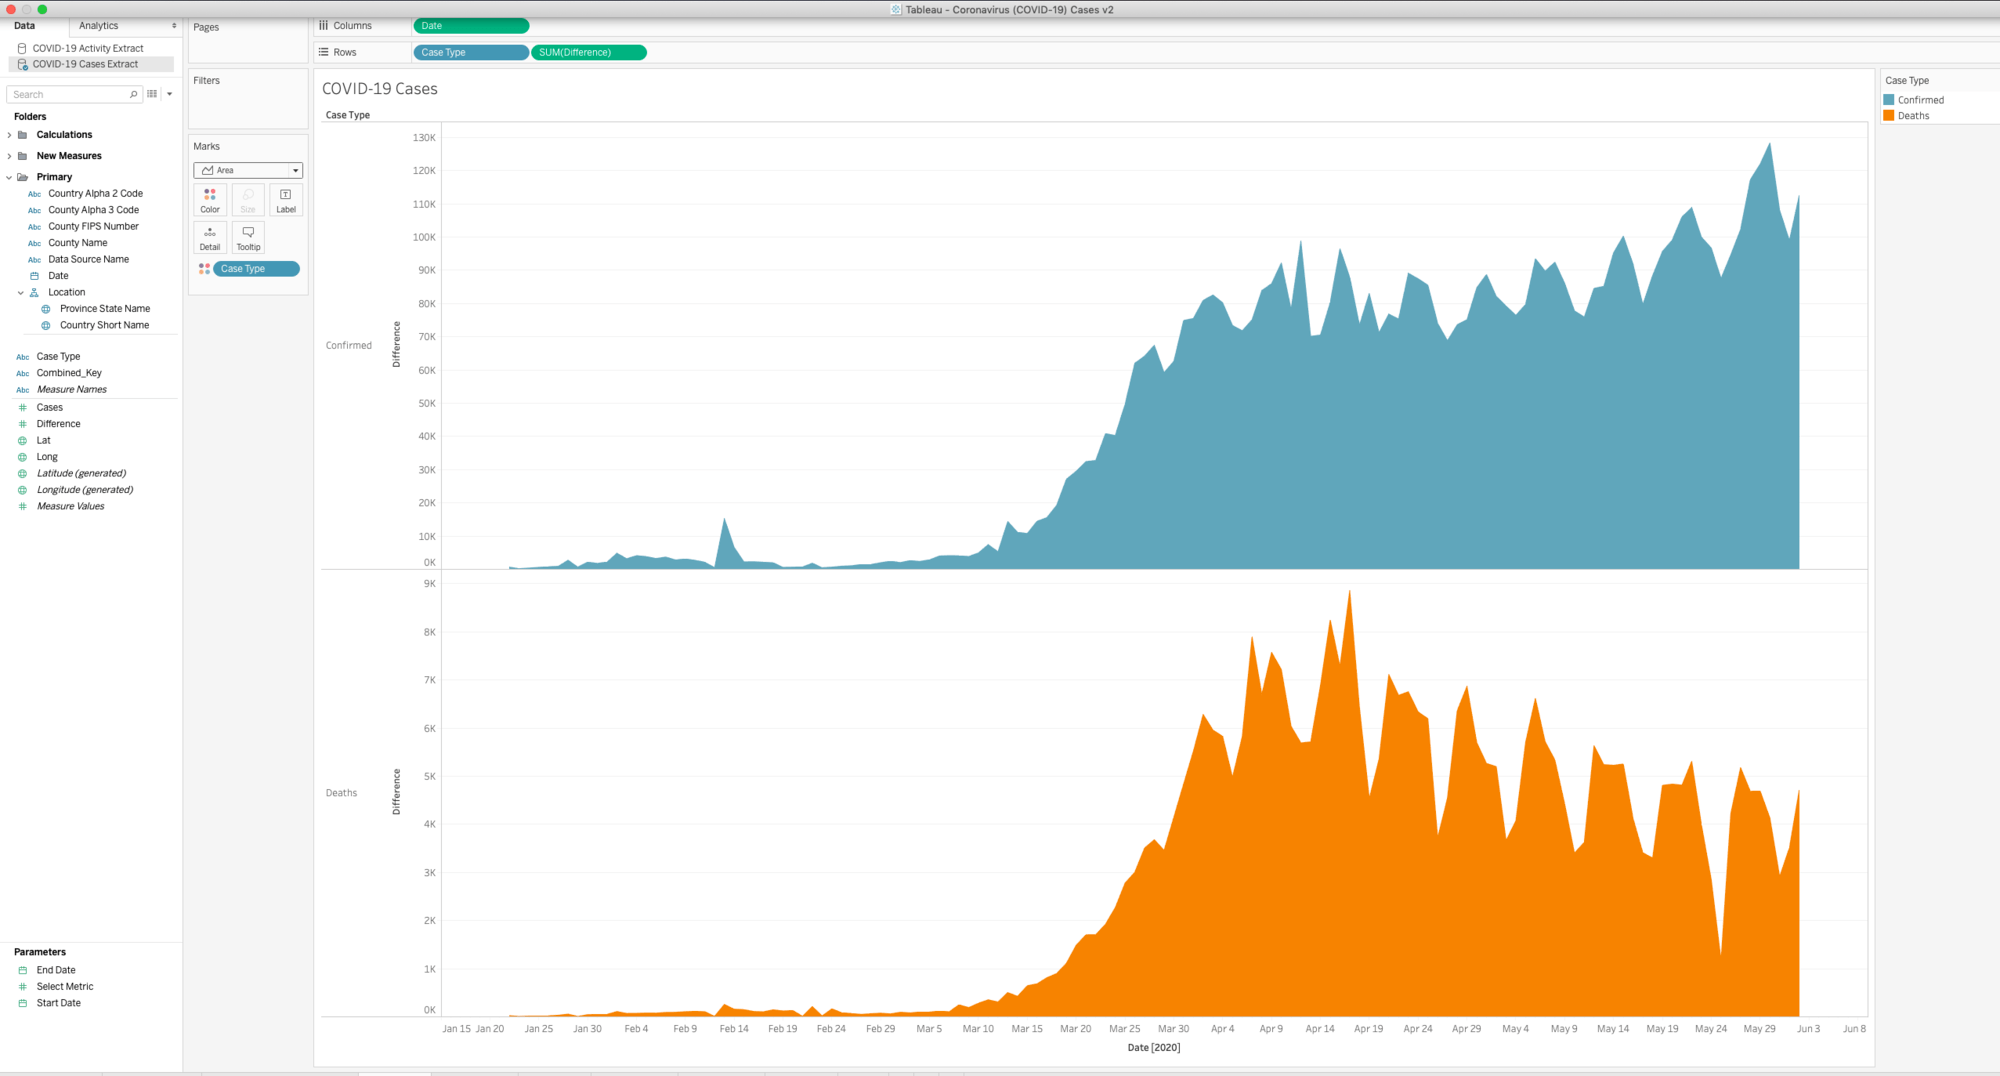
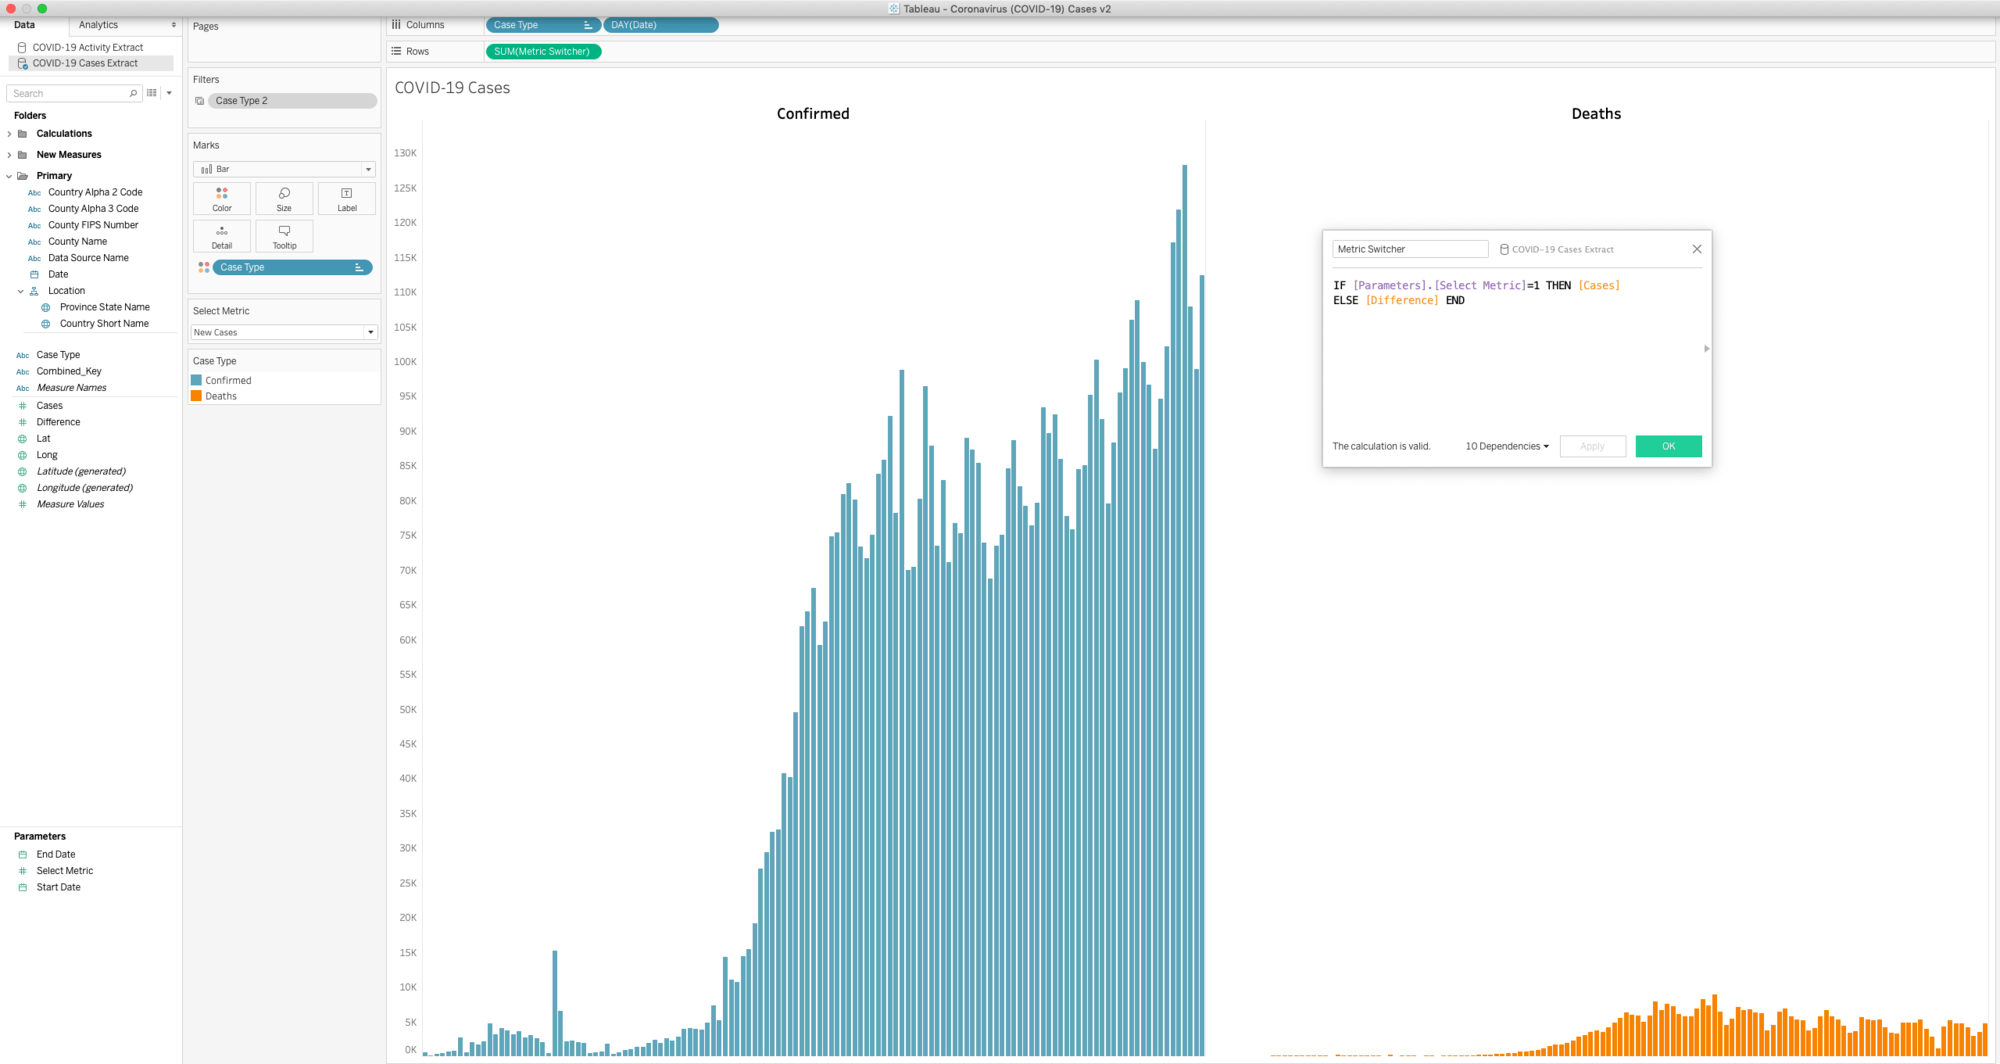
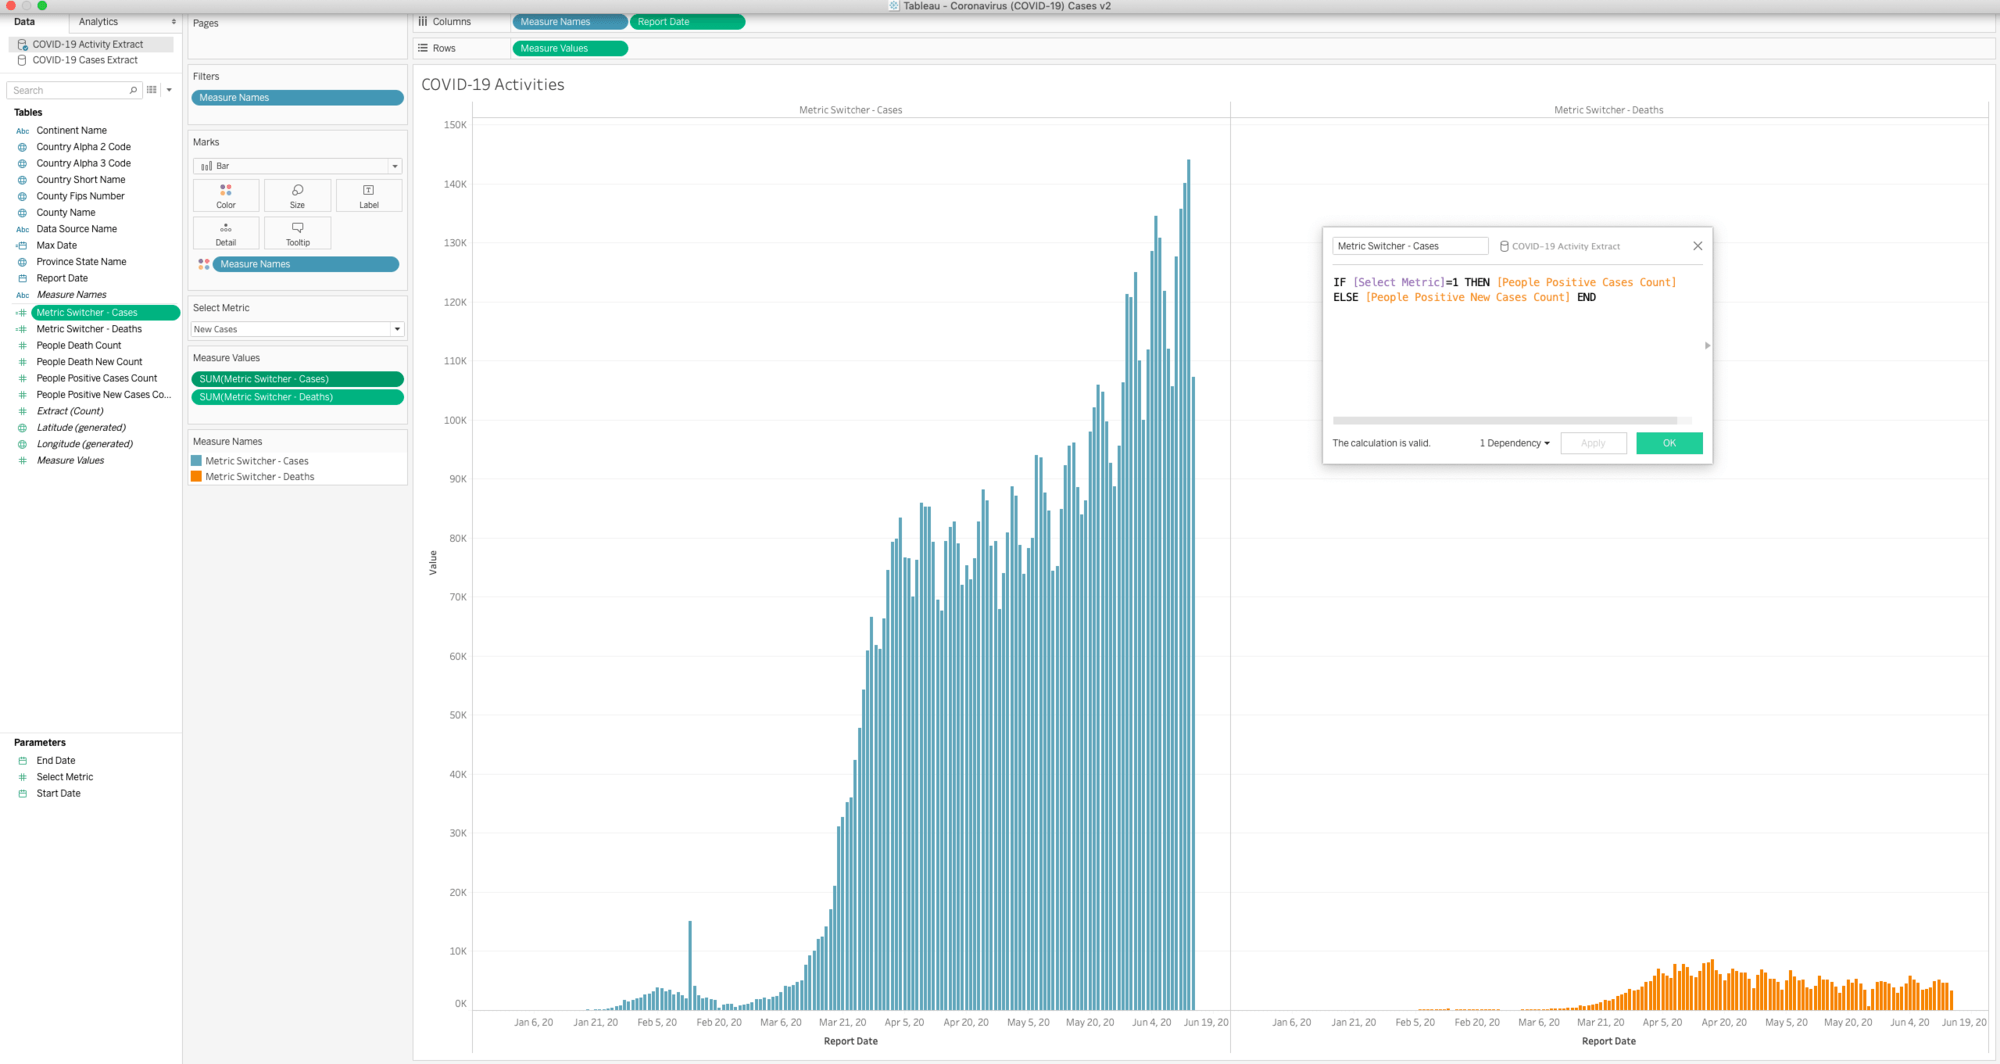
Step 12: Now, we’re ready for the Big Replace. Right click on the COVID-19 Cases data source and select Replace Data Source from the drop down menu. The value in the Current box should read COVID-19 Cases and Replacement should read COVID-19 Activities. Click OK.
It’s the moment of truth… load your dashboard or sheet and take a look. If there are any greyed out boxes that’s okay. It simply means that you still have an errant field in that sheet. Go to the sheet, update it with the correct field(s), and you should be good to go.
If you have questions or are struggling through the process of updating your workbook, join us in the Tableau forums. The community is ready to help you.
Articles sur des sujets connexes
Abonnez-vous à notre blog
Obtenez les dernières nouvelles de Tableau dans votre boîte de réception.


