Beyond the Default: Customizing Automated Data Insights with GROOT


As data visualization tools continue to evolve, the focus is shifting from merely displaying data to actively surfacing insights that guide users in their decision-making.
Automated insights, which highlight patterns such as correlations, outliers, and distributions, are becoming increasingly common in analytical workflows. The challenge with current automated insight systems is their lack of flexibility. Tools like Tableau's Explain Data or PowerBI’s Quick Insights operate in a black-box manner, generating insights based on predefined heuristics. While these insights often surface valuable information, they can overlook critical detail. For example, existing systems may emphasize correlations between attributes but fail to highlight the absence of a correlation. Similarly, they might call out extreme values without providing meaningful comparisons between data points that users might find more relevant. This lack of user control leads to frustration, especially for those with domain-specific knowledge that the automated system doesn’t account for.
GROOT, a system developed by researchers Sneha Gathani, Anamaria Crisan, Vidya Setlur, and Arjun Srinivasan, seeks to address this challenge by allowing users to interactively edit, reconfigure, and customize the insights they see during data exploration. A paper describing the system design and behavior was recently presented at the 2024 IEEE VIS Conference.
GROOT: Customizing Insights For Your Analysis

Figure 1: GROOT allows users to edit and reconfigure automated data insights by (1) selecting marks in charts to get recommendations of new insights based on the selection, (2) reconfiguring default insights by adjusting the template or insight generation thresholds, (3) adding new custom insights by specifying text templates for insights.
With GROOT, users can interact with charts to generate additional insights based on their selections. For example, by selecting specific data points on a bar chart (see Figure 1), users can prompt the system to generate new insights that emphasize the differences between those points or retrieve specific values. This moves beyond the default insights, giving users more control over the narratives that emerge from their data. In addition to offering new insights based on direct manipulation of the charts, GROOT allows users to adjust the underlying logic that drives insight generation. Users can reconfigure heuristics to better capture the nuances of their data. For instance, by lowering or raising the threshold for what constitutes an outlier, users can tailor the insights to fit their specific analytical goals.
A Walkthrough of the System

Figure 2: Three main views of GROOT: the data table view (A), the charts view (B), and the insights view (C).
To illustrate GROOT’s capabilities, consider Phoebe, a business analyst exploring sales data for her company. As she navigates through the three main views of GROOT — the data table (Figure 2A), charts (Figure 2B), and insights (Figure 2C), Phoebe selects attributes to filter her data, focusing on sales and region. GROOT responds by generating a series of charts and insights, including a strip plot showing sales variations across regions with outlier insights and bar charts highlighting extreme values for average and total sales per region.

Figure 3: A change in distribution observed for total Sales x Region bar chart before and after removing the rows having ‘Not Specified’ Order Priority.
While reviewing the total sales by region (Figure 3A), Phoebe notices that the Central region has the highest sales, whereas the South region lags significantly. She realizes some data entries for Order Priority are unspecified, so she removes them, updating the insights dynamically (Figure 3C). Once the data is cleaned, Phoebe digs deeper into the sales differences between the Central and South regions. By clicking on the respective bars, she receives new insights—one listing the sales for each region and another highlighting the disparity between them (Figure 1-1).

Figure 4: Difference insight between Central and South regions fromFigure 1-1 propagated to the Unit Price × Region bar chart (A). A Correlation insight is generated by default for a scatterplot of Sales × Profit (B). New Correlation insight propagated from Figure 1-2 to a scatterplot showing Sales × Product Base Margin (C).
Phoebe then adds the new insights to her charts and updates the insight generation logic, so these differences are automatically highlighted in future charts (Figure 4A). Curious about whether increased sales lead to higher profits, she examines a scatterplot that confirms a positive correlation between the two (Figure 4B). However, when she shifts her attention to sales versus discounts, the default system does not generate any insights. Using GROOT’s editing interface, she customizes the system’s logic to call out the absence of a correlation, lowering the threshold range and editing the insight template. This new insight propagates to other scatterplots, such as sales versus product base margin (Figure 4C).

Figure 5: Reconfiguring the Outlier insights for Shipping Cost (A) by examining its formula (B) and editing it (C) results in a reduced number of items highlighted as outliers (D).
As Phoebe explores further, she reconfigures insights to examine shipping costs. After seeing numerous outliers in a strip plot, she adjusts the system's formula for outliers, reducing the threshold for low-cost items and updating the insights accordingly (Figures 5A-D).

Figure 6: Specifying template for adding new Custom insight. “@” allows referencing attributes in the dataset (A), “=” is used to reference mathematical calculations (B), and “{}” allows defining formulae within the interactive editing interface.
Finally, Phoebe adds a custom insight to highlight the product category responsible for the highest shipping cost, using GROOT's interactive template specification interface (Figure 6).
What’s Next?
GROOT is more than just a tool for tweaking insights; it represents a shift in how we think about automated data insight systems. By giving users greater control over the insight generation process, GROOT enhances transparency and flexibility, allowing insights to be tailored to the user's domain knowledge. The system also opens up opportunities for future work, such as incorporating Large Language Models (LLMs) to suggest even more nuanced insights and explanations. However, while LLMs could be helpful in generating text-based insights and explanations, they may struggle with understanding the specific domain knowledge or subtle data intricacies that experts rely on, making user-guided customization still essential for high-stakes analysis. Much like its Marvel counterpart who branches out of his comfort zone to help the Guardians of the Galaxy protect the universe, there is further research to be explored for designing adaptive and intelligent data exploration partners, while offering flexibility and personalized insights.
Articles sur des sujets connexes

AI-Assisted Authoring of Text and Charts for Data-Driven Communication
 avril 4, 2025

Beyond the Visuals: Elevating Text as a First-Class Citizen in Dashboard Design
 octobre 16, 2024
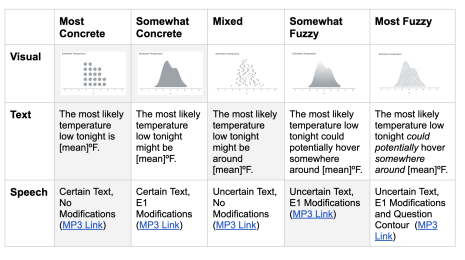
Exploring Data Uncertainty through Speech, Text, and Visualization
 août 9, 2024
Abonnez-vous à notre blog
Obtenez les dernières nouvelles de Tableau dans votre boîte de réception.