How to use Tableau with SQL Server on R and Python
We like to think of Tableau as the Switzerland of data because of its wide variety of connectivity options. But who said that connecting to a data source meant just reading data from a transactional database or data warehouse? If your database has in-database analytics capabilities, Tableau can take advantage of them to supercharge your analysis.
Tableau’s integration with R, Python and MATLAB is quite popular due to its platform agnostic nature but if the results from these languages are tables with arbitrary number of rows and columns or if you’d like to save the results in an extract, it wouldn’t be the right choice.
SQL Server is the most popular database among Tableau customers and has been building its predictive analytics capabilities over the past two years. SQL Server 2016 added the support to run R code inside the database while SQL Server 2017 extended it to Python. In this post I’ll talk about how you can leverage Microsoft SQL Server’s R and Python capabilities (Microsoft Machine Learning Services) with Tableau by going through two advanced analytics use cases.
In the first scenario, let’s say you’d like to analyze social media data on a daily basis and accumulate data in a Tableau data source to view how well the sentiment towards your topic of interest is changing. You can insert your Python code for this analysis as Initial SQL in your SQL Server data source in Tableau.
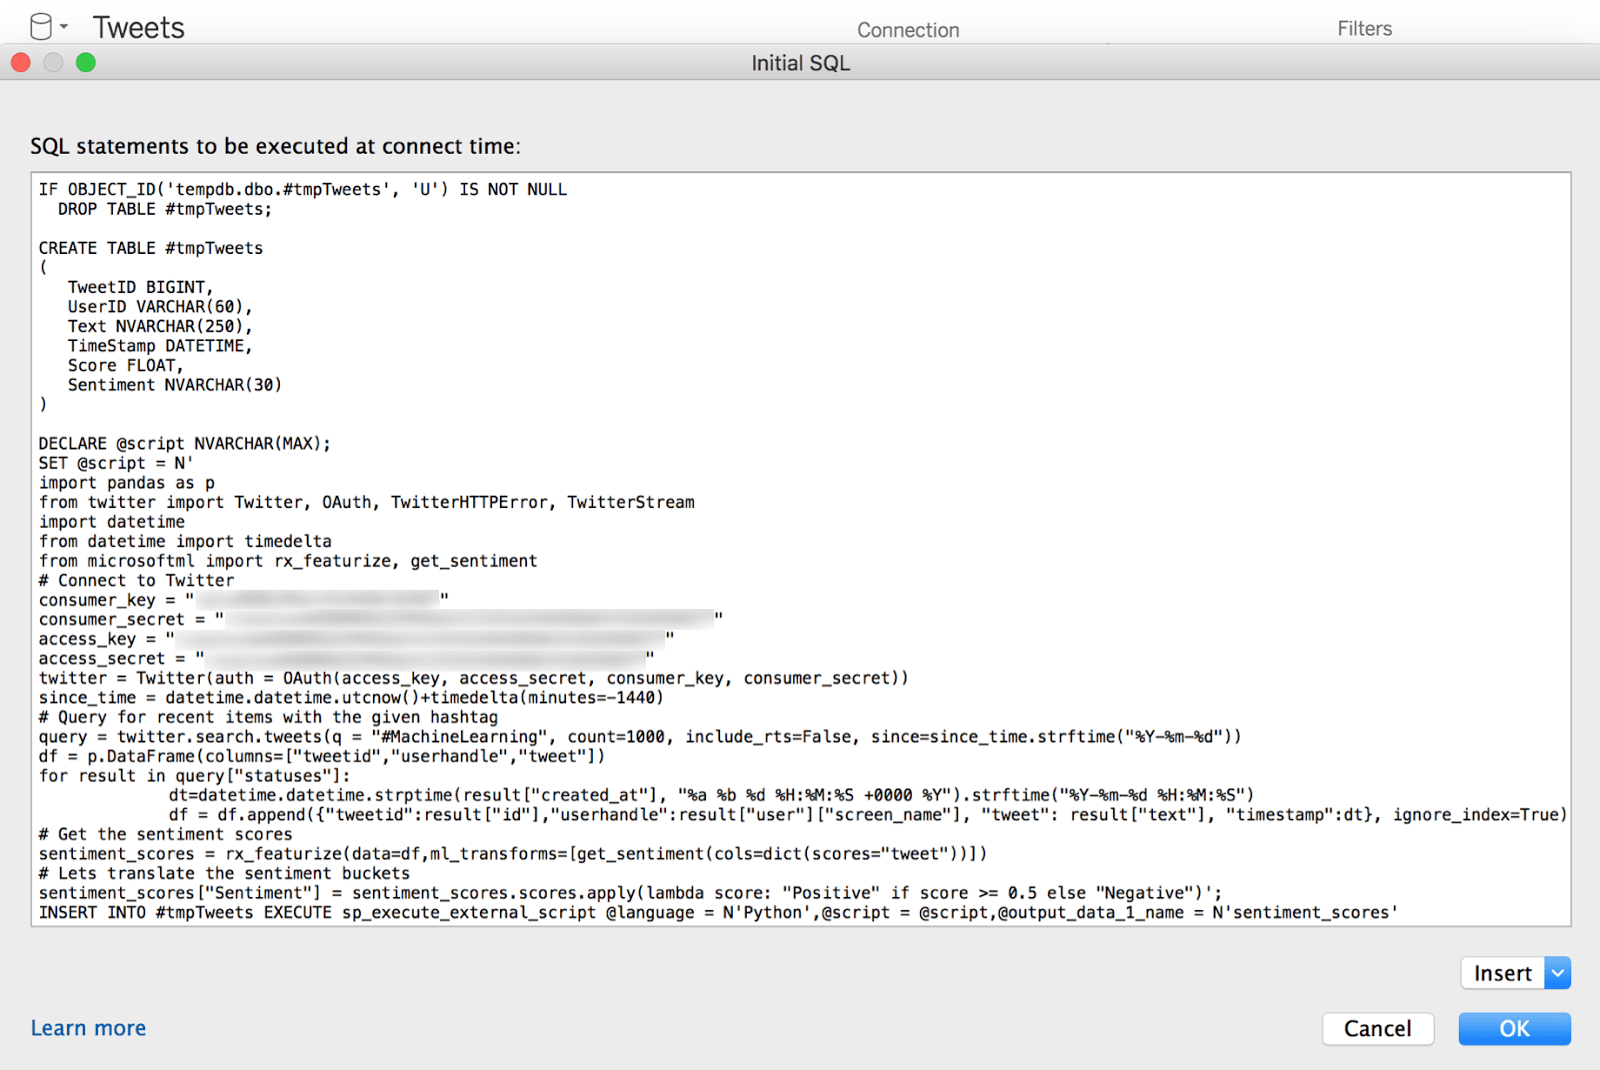
Here is a screenshot of the Initial SQL dialog screenshot showing a code excerpt (I’ve blurred out my account info).
This example relies on SQL Server’s integration with Python to retrieve one day’s worth of data for the hashtag #MachineLearning from Twitter and then run it through pre-trained sentiment analysis models provided by Microsoft for usage with SQL Server. To get the data into Tableau we need to use Custom SQL to retrieve results from the temporary table generated by Initial SQL.

The result is a table returned to Tableau that includes the original tweet, tweet ID, user handle, date time, associated sentiment score, and sentiment classification.

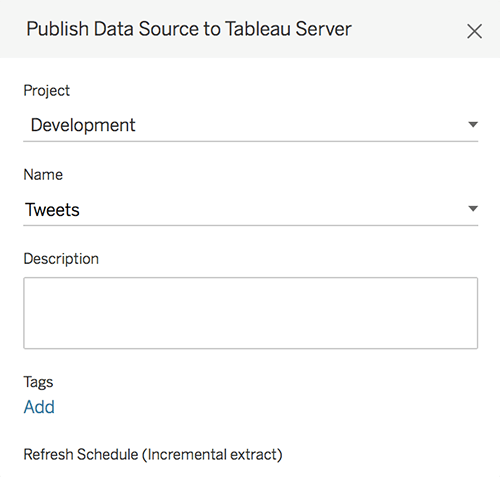
The next step is to run the report on a schedule so that only new data gets appended to historical data. You can do this by publishing this data source to the server with an incremental extract refresh schedule, as seen in the screenshot below.
I can quickly build a visualization using this data source to see the sentiment change over time and see new data and analysis results getting automatically added daily.
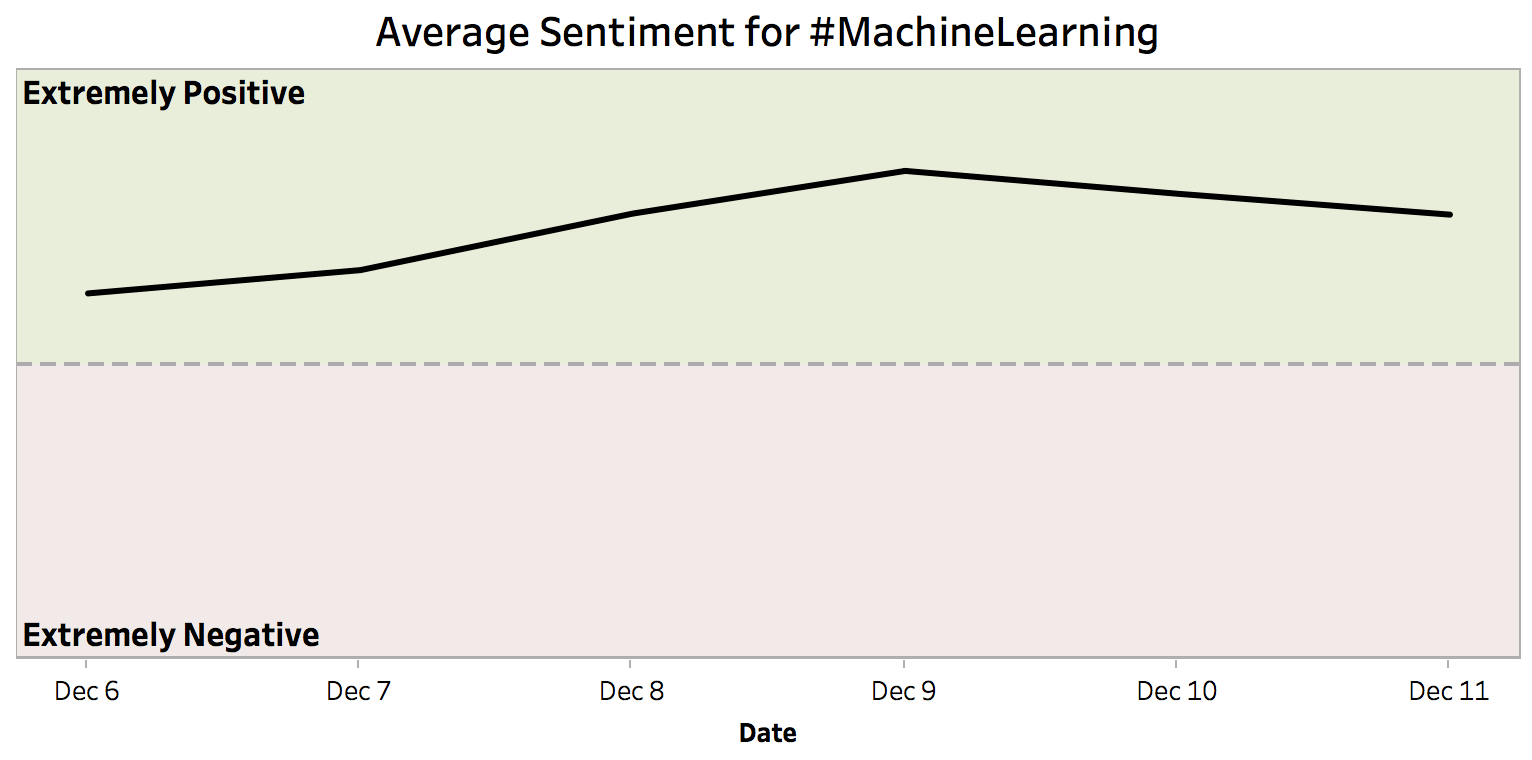
It looks like the sentiment about Machine Learning has been positive. You can download the Initial SQL script used in this example here.
In order to get this process to work for you, please make sure SQL Server Machine Learning Services and pre-trained models are installed, external script execution is enabled, necessary R (forecast) and Python (Twitter) packages are installed, and “network access for R local user accounts” is not blocked on your database.
In the first example, I was able to insert my code directly into Tableau-which is a great way for ad-hoc use cases. However, businesses often want to use predictive models in production and would prefer exposing them as standardized methods-which in the case of databases often means using stored procedures.
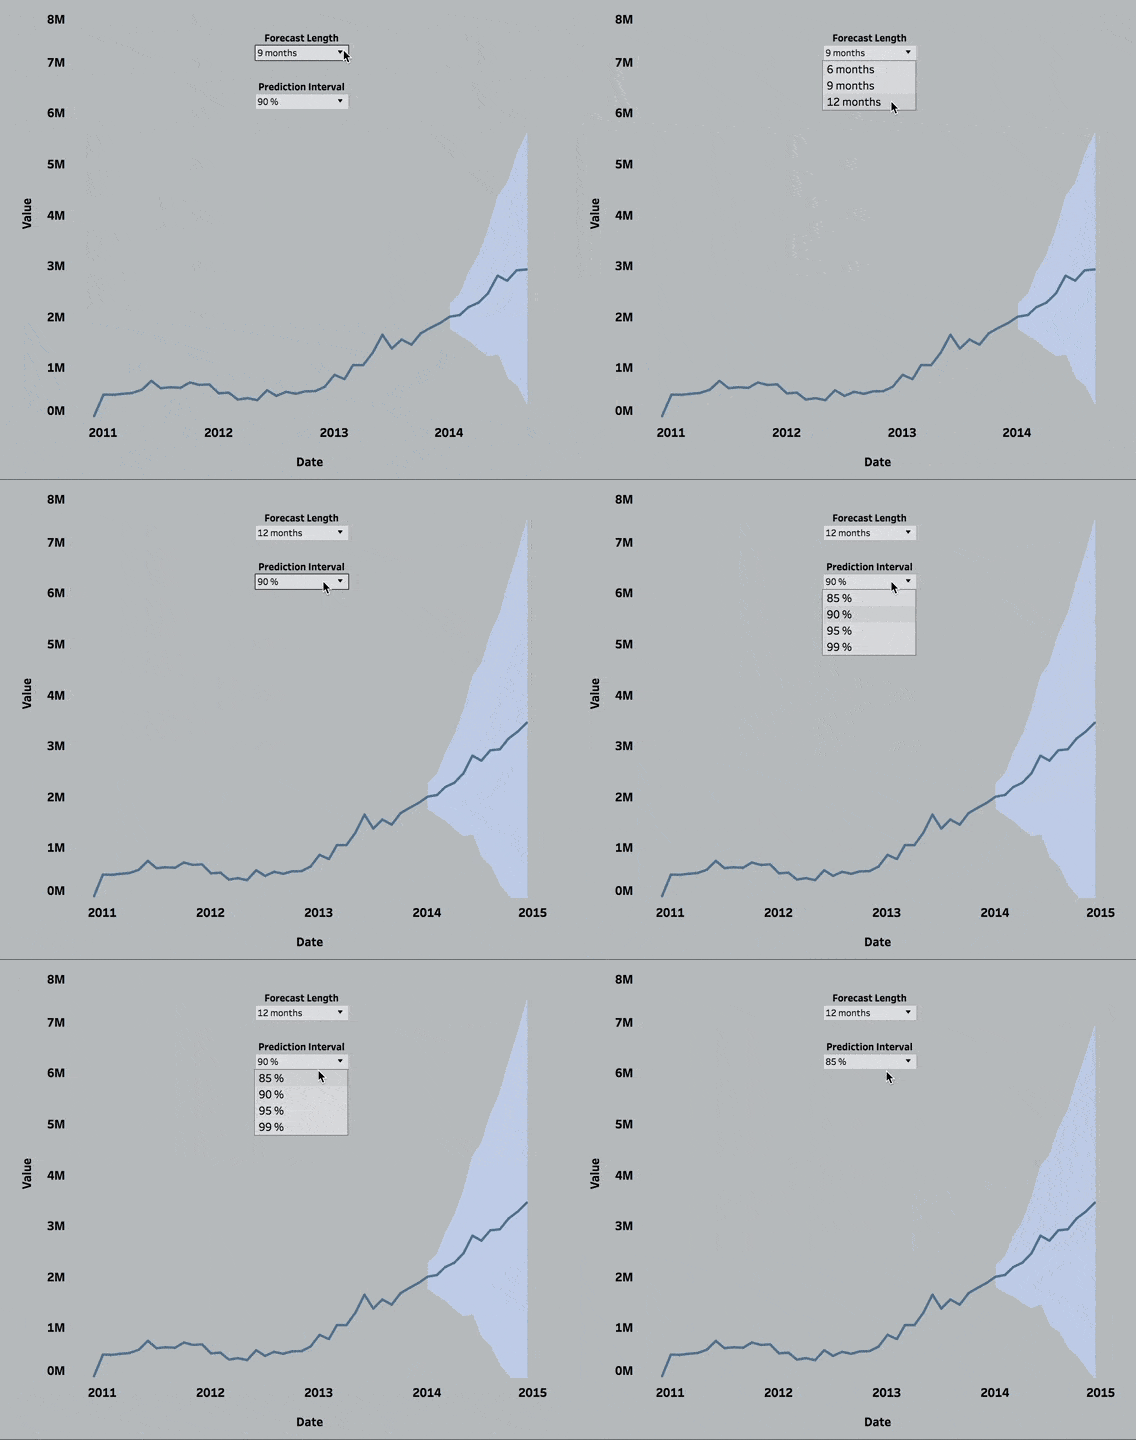
Let’s use R in the next example to create a stored procedure with input parameters. This allows consumers of the corresponding visualization in Tableau to customize the output by specifying criteria such as length of the forecast and extent of the prediction bands.
I can create my stored procedure using SQL Server Management Studio as seen in the example below.
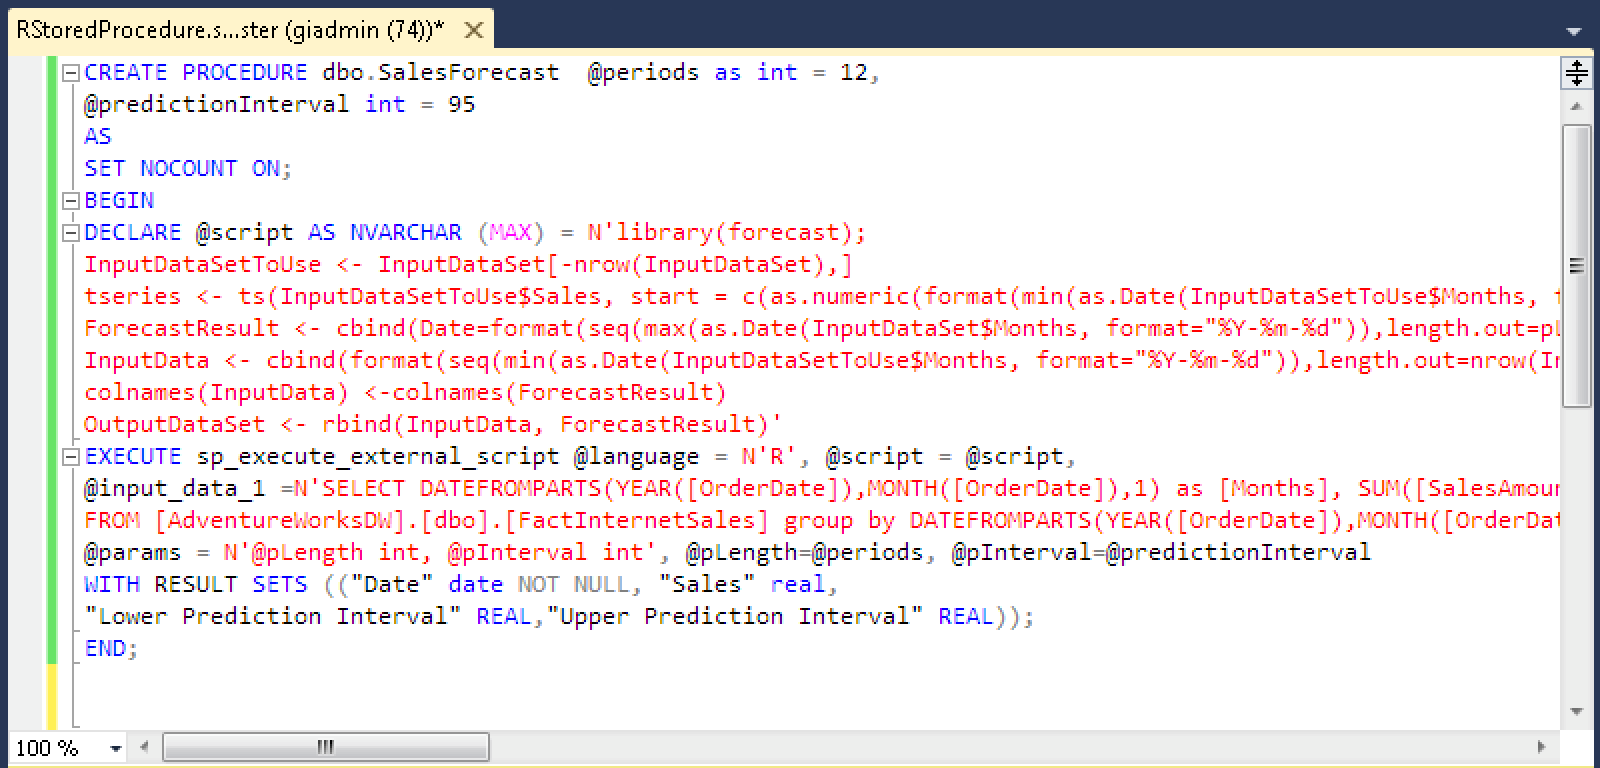
You can download the SQL Script for this example from here.
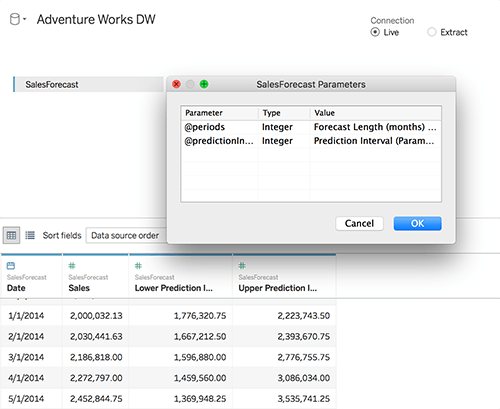
Once this is done, upon connecting to this database, I can see my stored procedure in the data preparation tab in Tableau. After I drag it into my join diagram and assign inputs the parameters, I am ready to use it in my visualization. The screenshot below shows the stored procedure configuration in Tableau.
Now I can tweak the parameters and get new forecasts from the database instantly.
Use case: Applications in retail
This analysis has several applications across many industries. In retail, for instance, daily visibility into social sentiment around products can inform management how deeply customers feel about products, as well as which features are responsible for those feelings. The merchandising team could then collaborate with the marketing team to highlight key features that resonate with customers. Negative sentiment could lead to a faster markdown strategy to eliminate unwanted and expensive inventory. On the other hand, forecasting models in production serve to predict and meet the demands of consumers in retail establishments while controlling pricing and inventory. With the joint Tableau on MSFT Azure solution, users are able to further democratize this data with self-service analytics. The automation, sharing and collaboration of analytics can turn insights to actions, and accelerate impact across the organization.
This is a quick preview of how you can take advantage of SQL Server’s R and Python integration in Tableau. Considering the extensive set of machine learning libraries these languages offer, the possibilities are endless. We’re looking forward to seeing what kind of brilliant solutions you will come up with!
To learn more about how to use Tableau’s integration with various technologies most efficiently to solve different business problems, check out the recording for my session at Tableau Conference 2017. To learn more about SQL Server Machine Learning Services you can take a peek here.
Acknowledgments: This article is a collaboration between several people. Special thanks to Bharath Sankaranarayan (Microsoft) and Gil Isaacs (Microsoft).
Articles sur des sujets connexes
Abonnez-vous à notre blog
Obtenez les dernières nouvelles de Tableau dans votre boîte de réception.


