How to Make Tile Grid Maps in Tableau
Note: This is a guest post by Tableau enthusiast Brittany Fong.
Recently at work, my colleagues and I were introduced to a new map type that one of our users saw on FiveThirtyEight—tile grid maps! I quickly searched Google images to see what she was talking about. Immediately we knew this was possible in Tableau, and I'm excited to share the steps.
We agreed that this map was useful because:
- You could easily see all of the states (Alaska, Hawaii, and the small northeastern states).
- All the states were the same size, so Texas doesn't seemingly have more emphasis than Rhode Island.
The idea is pretty simple. I broke the map into a grid and created a template in Excel. After creating the template, I connected to the data in Tableau and:
1. Put "rows" onto rows.
2. Put "space" onto columns.
3. Put "state" onto the level of detail.
4. Created a random calc for dummy data and put it on color (optional: change colors and add a border).
5. Optional: To add space between the squares, create a "one" calculation where the calculation contains 1. Drag up to dimensions and add to size. Adjust the size to get the preferred amount of white space.
6. After that, I just had to adjust the cell sizes and format the text.
Then the Question Was: How Do I Get Actual Data onto the Map?
The first idea that came to mind would be to pre-aggregate each state and just add it to the Excel template. However, in many cases, that is not possible.
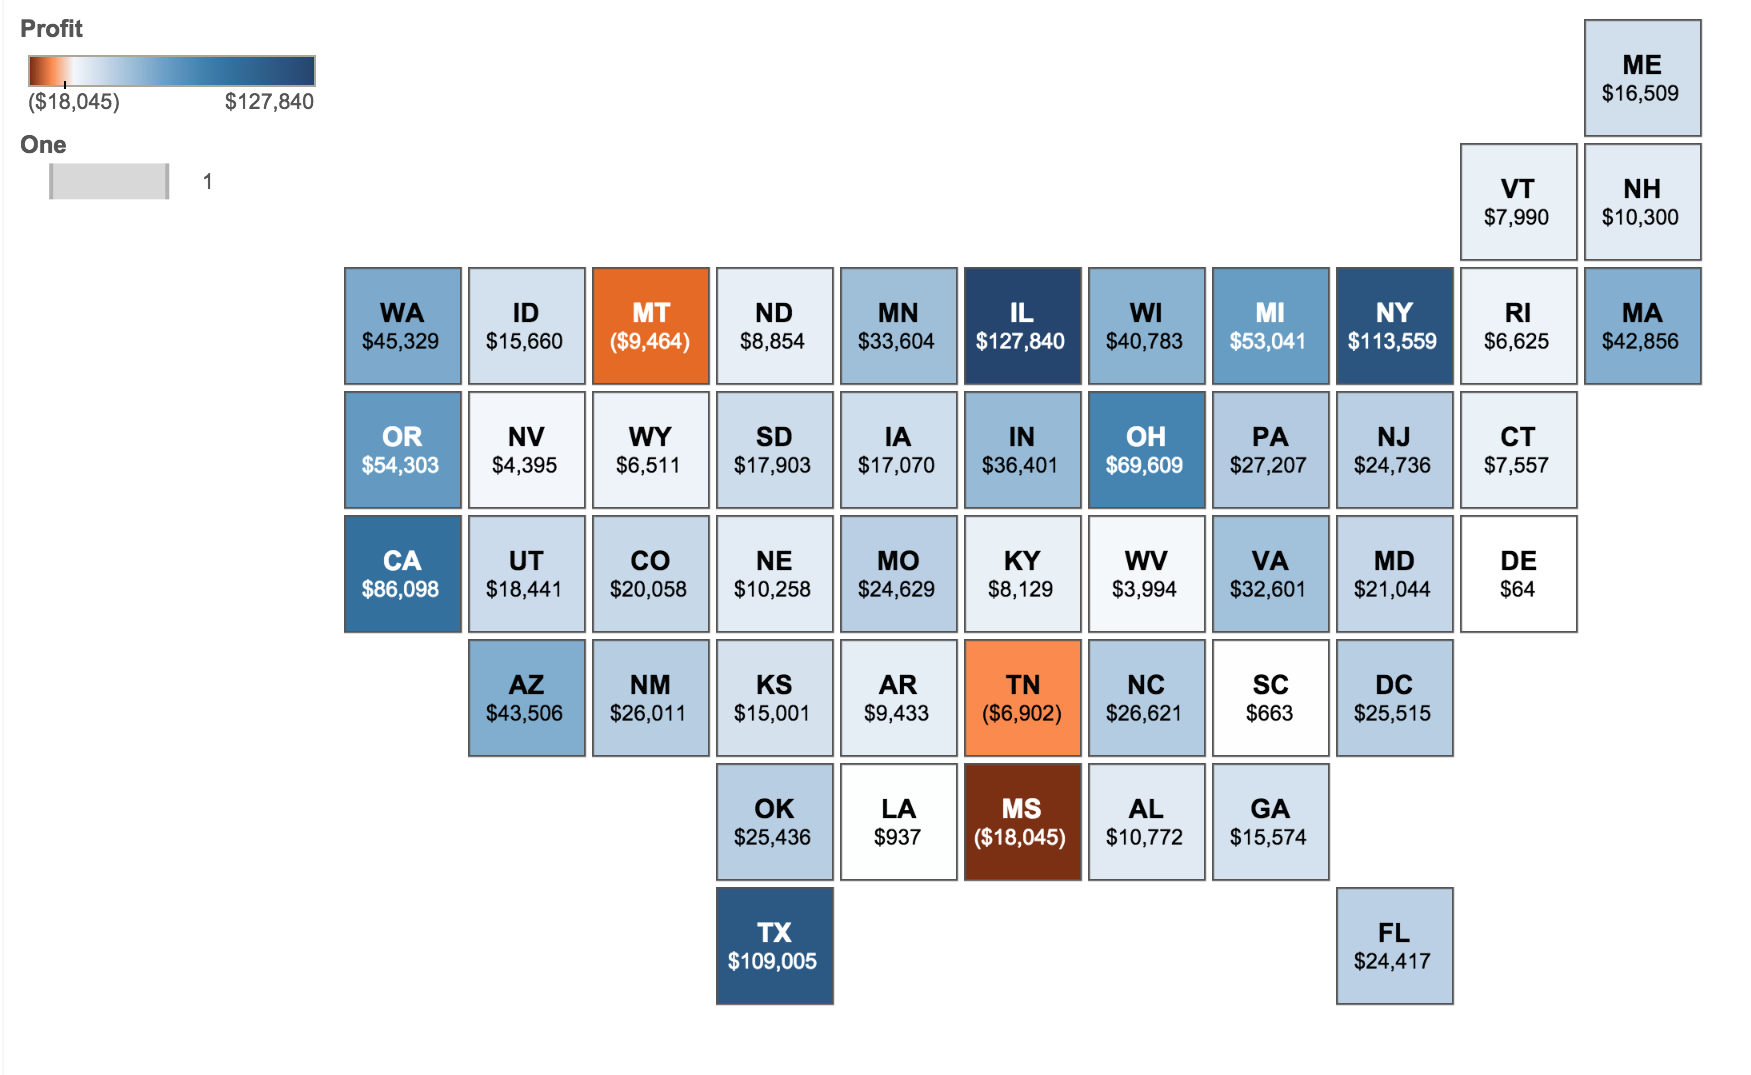
To get actual data on the map from a different data source, I blended my map template in Excel with the superstore data (which ships with Tableau). Both data sources must have a matching state field. Depending on your fields, you may need to adjust the relationships. Here are the steps:
1. From the superstore data, put state onto detail and remove the generated latitude and longitude from the rows and columns.
2. From the dummy example, I followed steps 1 and 2 (put "rows" to rows and "space" to columns).
3. Instead of adding the random calculation to color, add the superstore measure that you want to measure to color.
4. Follow the rest of the steps from the dummy example.
And here’s my tile grid map made in Tableau (click to interact):
Want to go one step further? Check out Matt Chambers's guide on creating hex tile maps in Tableau.
For more works by Brittany, visit her Tableau Public page and her blog, bfongdata.com.
Abonnez-vous à notre blog
Obtenez les dernières nouvelles de Tableau dans votre boîte de réception.


