Relationships: Asking questions across multiple related tables
This post covers asking questions across multiple tables with relationships—using sets, LoD expressions, and aggregate calculations. Just like in the previous posts, we are using the bookstore dataset—you can follow along by downloading this Tableau workbook.
With the Tableau 2020.2 release, we’ve introduced new data modeling capabilities that make it easier to combine multiple tables for analysis. In this blog series, we’ve covered an introduction to relationships, and shared tips and tricks with filters and row-level calculations. This post covers asking questions across multiple tables with relationships—using sets, LoD expressions, and aggregate calculations. Just like in the previous posts, we are using the bookstore dataset—you can follow along by downloading this Tableau workbook.
Set analysis: classifying unmatched values
Many analytic questions require classifying records by whether they exist in another table. For example, what percent of books have awards? Of books with awards, what percent have no sales?
Part 1: What % of books have awards?

Numerator: Books with Awards Denominator: All Books The numerator requires a cross-table calculation, while the denominator can be calculated just from the Book table. A good practice is to bring all calculations to a single table, so it’s easier to reason about the level of detail and the set of records included in your calculation. To find books with awards, we essentially want to flag each row in the Book table as True/ False, indicating if the book exists in the Award table. We can calculate this with a set or a level of detail expression. Think of the following LoD Expression as the Book table pulling in the number of matching records from the Awards table. If there’s one or more, then the book has an award.

Since the above LoD expression belongs to the Book table, “1” represents a book, as per the tips and tricks shown in the previous post.

Part 2: What % of books with awards are unsold?

Numerator: Books with Awards without Sales Denominator: Books with Awards To find books without sales, we can bring the Number of Sales into the Book table to create a True/False flag per book. When the number of sales per book is 0, the book has no sales.

Note that since Sales is related to Book through the Edition table, this doesn’t tell us why the book has no sales. It could be because the book is unpublished, or it could be because the book is published but unsold. However unpublished books cannot receive awards, so we can assume that books with awards that have no sales are unsold books. It’s important to understand the relationships in your data to accurately author and interpret the results of calculations. Combining this LoD expression with the LoD from the previous example, we can calculate the percentage of books with awards that are unsold.

Note that while LoD expressions are grouped with their table, aggregate calculations are not grouped with any table, because their level of detail is only established when they’re used in a visualisation.
Disambiguating questions: the measure, the source of the measure, and the dimension
Data analysis requires translating business questions into unambiguous computable questions. A business question might be, “Do experts and the general population agree on which books are good?” You might use awards to determine expert opinions and ratings to determine the general population’s opinion. “What are average ratings per award?” may seem like a reasonable translation of the business question. However, this is still ambiguous because “ratings” is ambiguous. Is it the measure or is it the table the measure belongs to—the source of the measure? A more precise question is “What is the average rating for reviews related to each award?” (This ignores the book.) An alternate question could be “What is the average rating for books that have earned each award?” (This ignores the number of ratings each book has.) These questions give different answers. The first questions weights all ratings equally. If one book receives all the ratings, that book will be disproportionately represented. The second question weights all books equally, regardless of how many ratings each received. The first is the average, while the second is the average of the average. There’s a many-to-many relationship between ratings and awards, while there’s a one-to-many relationship from books to awards. Understanding the cardinality in your data can help you pick the right level of aggregation for your question. While a calculation can be logically and mathematically valid, correctness can only be determined with respect to the intended question.
Average rating for reviews related to each award
Since the rating measure comes from a table with one record per review, this result is given by simply splitting average ratings by awards.
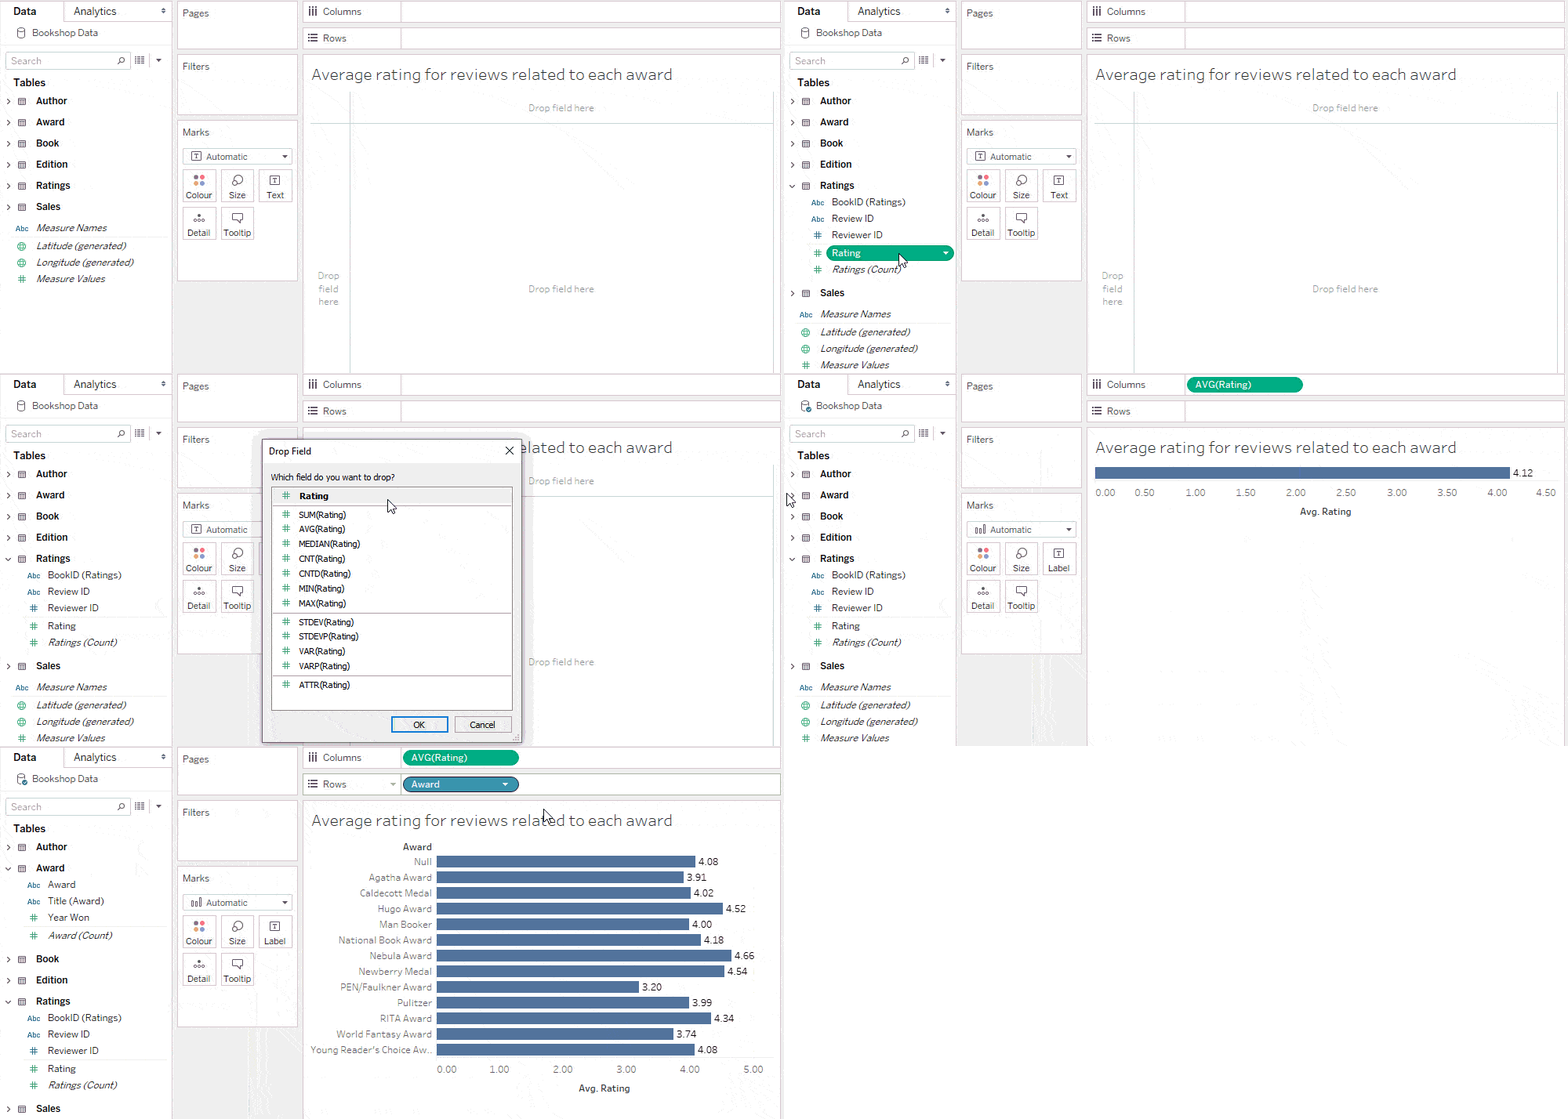
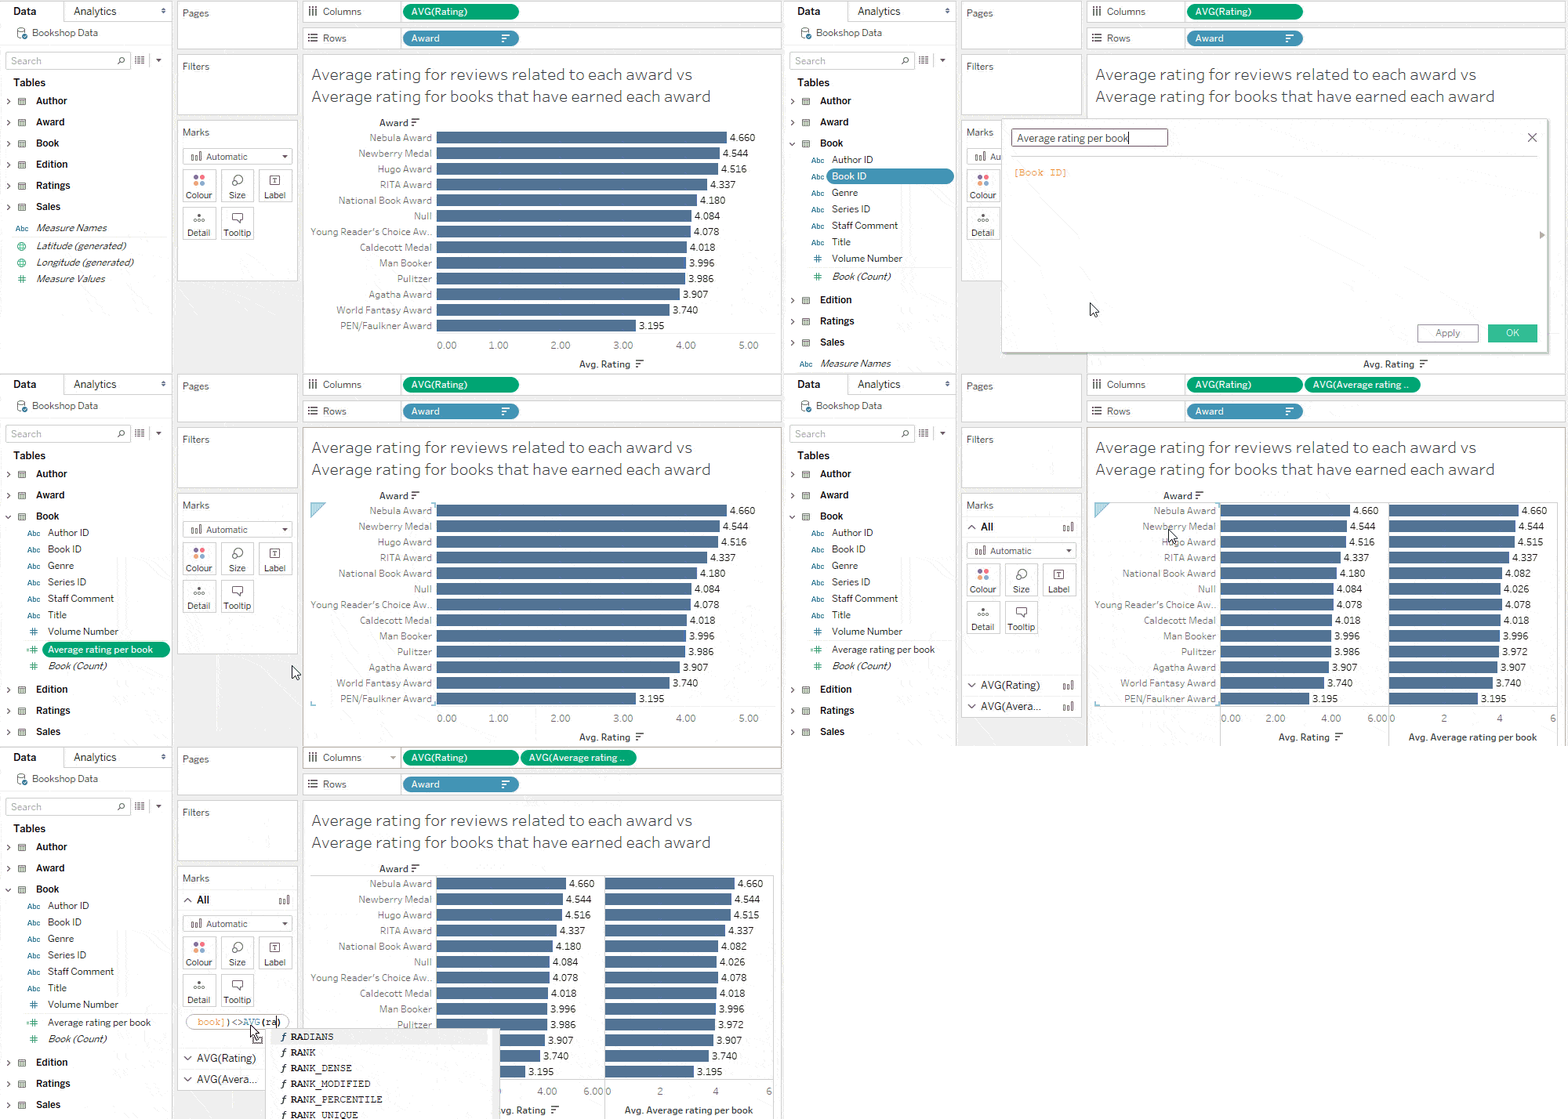
Average rating for books that have earned each award
To calculate this result, we must move the average rating to the books table.

We can accomplish this with an LoD expression that calculates the average rating by book.

The source of this new measure is Book, therefore the average of this calculation split by award gives the desired answer.
Interpreting Results: the measure, the source of the measure, the dimension, and the relationship
It’s useful to consider the measure, the source of the measure, the dimension, and the relationship when interpreting the results of your analysis. Understanding the relationships between tables is particularly important for interpreting the level of detail of unmatched nulls. The viz from our previous analysis shows that experts and the general population are often not in agreement. Half of the awards have lower average book ratings than unawarded books.
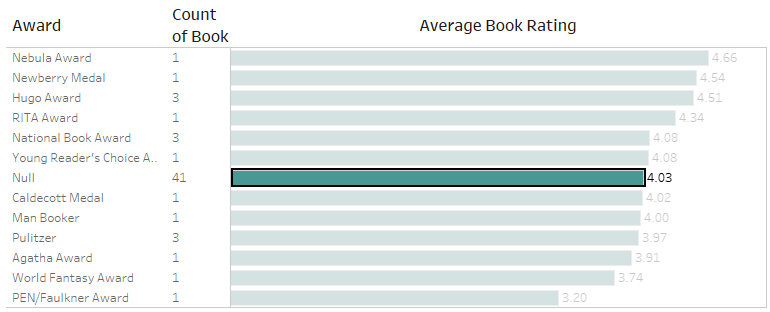
To see the extent of the differences in opinion, wouldn’t it be nice to compare the difference between average book ratings for each award and average book ratings for unawarded books?
Calculations across tables: Bringing row-level calculations to a common table
There are three steps required to calculate this difference across aggregate rows:
- Isolate the measure for the unmatched null
- Replicate the unmatched null measure across all awards
- Subtract the result from the original measure

1. Isolate the measure for the unmatched null
For the first step, you may be tempted to write the following row-level calculation across tables, which returns no data.

This is because row-level calculations across tables use inner joins, dropping books without awards. The ISNULL expression will only find missing values, not unmatched values. The last tip in the previous post discusses this in detail. A good practice for writing row-level calculations across tables is to bring all fields to a single table. The reason is because row-level calculations generate row-level joins, creating an implicit table that is distinct from all the tables in your data model. Bringing all relevant fields into the same table before computing the row-level calculation makes it easier to reason about the level of detail and the set of records included in your calculation. Average Rating per Book (the LoD calc from the prior example) is already at the Book level of detail. We just need to make ISNULL(Award) resolve at the Book level as well by tying it to Book ID.
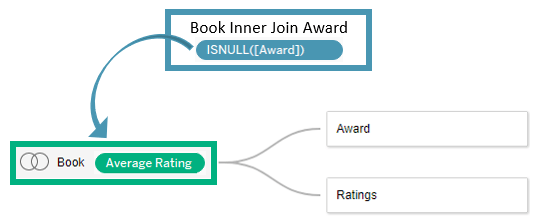
Finding unmatched null awards is equivalent to finding the set of books that have zero awards.

This calculation returns a single value that is the average rating for books that have no awards.
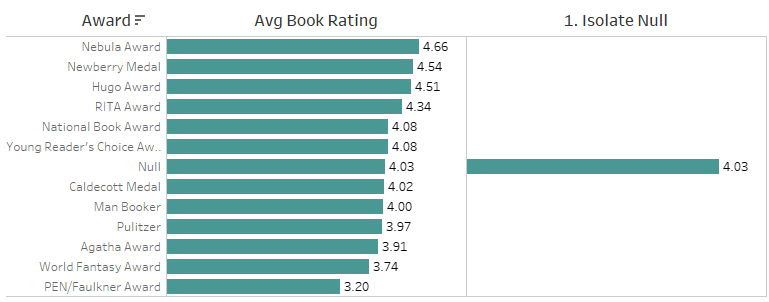
2. Replicate the unmatched null measure
An EXCLUDE LoD expression replicates the result across all awards.

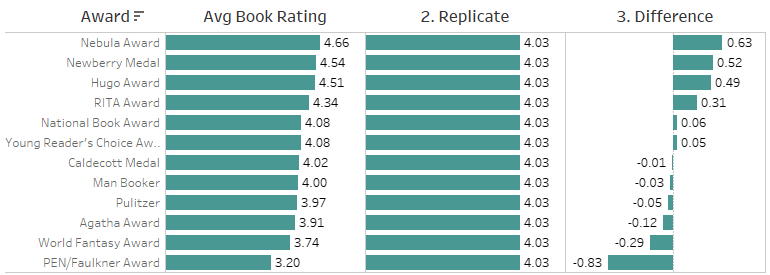
This calculation repeats the value of the Isolate Null Measure calculation for every award—an intermediate step necessary to compute the differences.

3. Compute the difference
The final step is now a straightforward aggregate difference. Note that the recommendation to bring calculations to a common table applies specifically to row-level calculations. With aggregate calculations, it’s often preferable NOT to fix them to any level of detail so that they adapt to the context of the viz and its filters.

This calculation, when visualized by award, will show the difference between the average rating for that award and the average rating for books with no award (the replicate field). Hiding the null then gives the desired result. If you exclude the null, the replicate field (and consequently the difference) becomes null because the relevant data is filtered out. Hiding allows us to include data in calculations, while excluding it from the viz.
Down the rabbit hole
You may be wondering why the EXCLUDE LoD expression didn’t replicate the measure for the unmatched null row. The documented answer is that LoD expressions are evaluated at the row level, and row-level calculations across tables use inner joins. You may be thinking, “That’s silly, why not use outer joins?” Bullet point #1 under the product management job description is apologising to the customer—that moment is now. Building a product requires disproportionately answering the question, “Which is the least worst option?” With relationships, that question repeatedly cropped up in the context of what to do with null values. There are two distinct types of null values.
- Missing values: A row exists but a value for a column is absent.
- Unmatched values: A join with another table conjures a row into existence.
These two types of nulls have very different meanings. Grouping both as “dirty data that we’ve all developed a reflex for excluding because it’s hard to think about” is bad. One decision we had to make is whether row-level calculations across tables happen before or after the tables are joined. It would be awesome if the software could always magically pick the order you wanted, but alas, computers implode under ambiguous instructions. We decided to run row-level calcs before the join, so that you can still distinguish between missing values and unmatched values when using the ISNULL function. This can sometimes give counter intuitive results, like in the table below. With an LoD calc that counts the number of awards per book, you can identify the unmatched null.
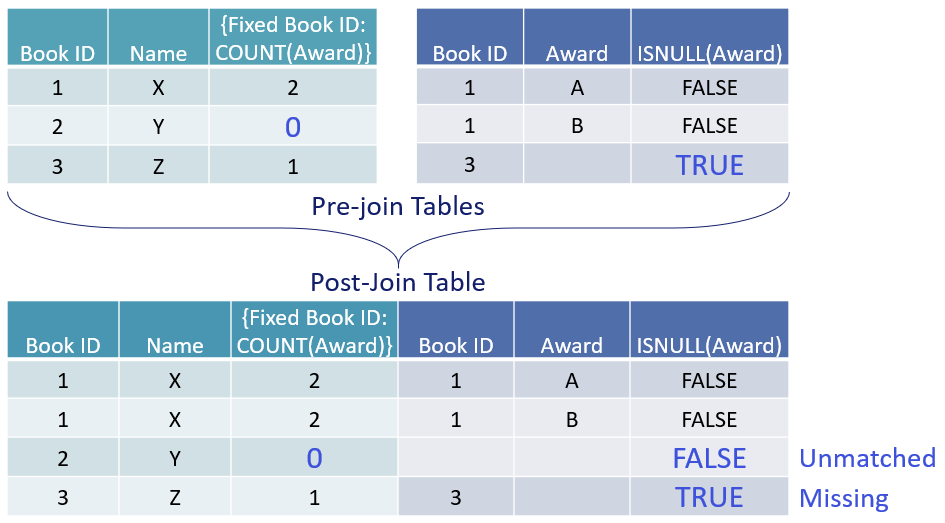
If row-level calcs happened after the join, the only way to differentiate missing values from unmatched values would be to pre-compute them in your data, requiring custom SQL or duplicate copies of your data. We thought that would be far worse, so a side effect of the least worst option is that LoDs should be used instead of the ISNULL functions to identify unmatched values, as shown in the image above. You may still be wondering why then, was the measure not replicated across the unmatched null in the EXCLUDE LoD expression, if LoDs are supposedly the saviour of nulls? LoDs can only rescue straggling unmatched nulls that can be pulled into a pre-join table (one of the rectangles in the data tab). LoDs are defenseless against unmatched nulls conjured in post-join tables that only exist in virtual space. Our last viz looks so real, but it’s just a shadow of a non-existent table. If you’re not rolling your eyes or rapidly seeking the escape button—congratulations! You have survived the customer advisor screening process. Get in touch with the data modelling and calculations PM team on dmcpmteam (at) tableau (dot-com)! Do not fear the impersonal alias—we’re a small group of four, and would love to learn more about what you need from Tableau.
Summary
Relationships expose nuance in your data that was previously easy to overlook, like
- The level of detail of your measures
- Unmatched values across tables
- The cardinality between tables
- The path to reach one table from another
Analysing data effectively is a matter of asking good, precise questions and interpreting the results beyond the field names. If you get results you didn't expect, before you dig into SQL log files for an explanation, make sure you can describe the relationships in your data—and your question—in plain English. In case you missed them, check out the other topics we’ve covered in this series on relationships:
- An introduction to relationships, looking at semantics.
- Tips and tricks for relationships, looking at filters and row-level calculations
You can also read more about relationships in our Help documentation.
Historias relacionadas
Suscribirse a nuestro blog
Obtén las últimas actualizaciones de Tableau en tu bandeja de entrada.


