DataFam Roundup: September 16-20, 2024


Welcome! Dig into this week's DataFam Roundup—a weekly blog that brings together community content all in one post. As always, we invite you to send us your content—and the DataFam content from your peers that have inspired you! Find the content submission form here.
Community Highlight
To recognize new and consistent Tableau contributors—we’re excited to have a section within the weekly DataFam Roundup called the Tableau Community Highlight. Find out how to get involved.
Kimberly Coutts, Research Analyst @ MiraCosta College
California, USA
Kimberly Coutts is a Research Analyst at MiraCosta College. She uses Tableau to create dashboards that help decision-makers guide the operations of the institution with topics ranging from enrollment and fiscal matters to illustrating the student experience. She appreciates that using Tableau has made tasks that used to be tedious now can be done with a few clicks, resulting in conversations that are far richer, allowing her team to focus on the meaning of the data rather than simply churning out the next report.
Outside of work, Kimberly is highly involved in the Tableau community, co-leading the California Community Colleges Tableau User Group, presenting at multiple Tableau Conferences, publishing vizzes on Tableau Public, participating in community projects like Makover Monday and Workout Wednesday, and posting on the Tableau Forums. Kimberly enjoys using Tableau in her free time to pursue her interests and broaden her skillset, such as visualizing data that tracks her progress in her weekly archery league.
Connect with Kimberly on Linkedin, X, and Tableau Public.
DataFam content
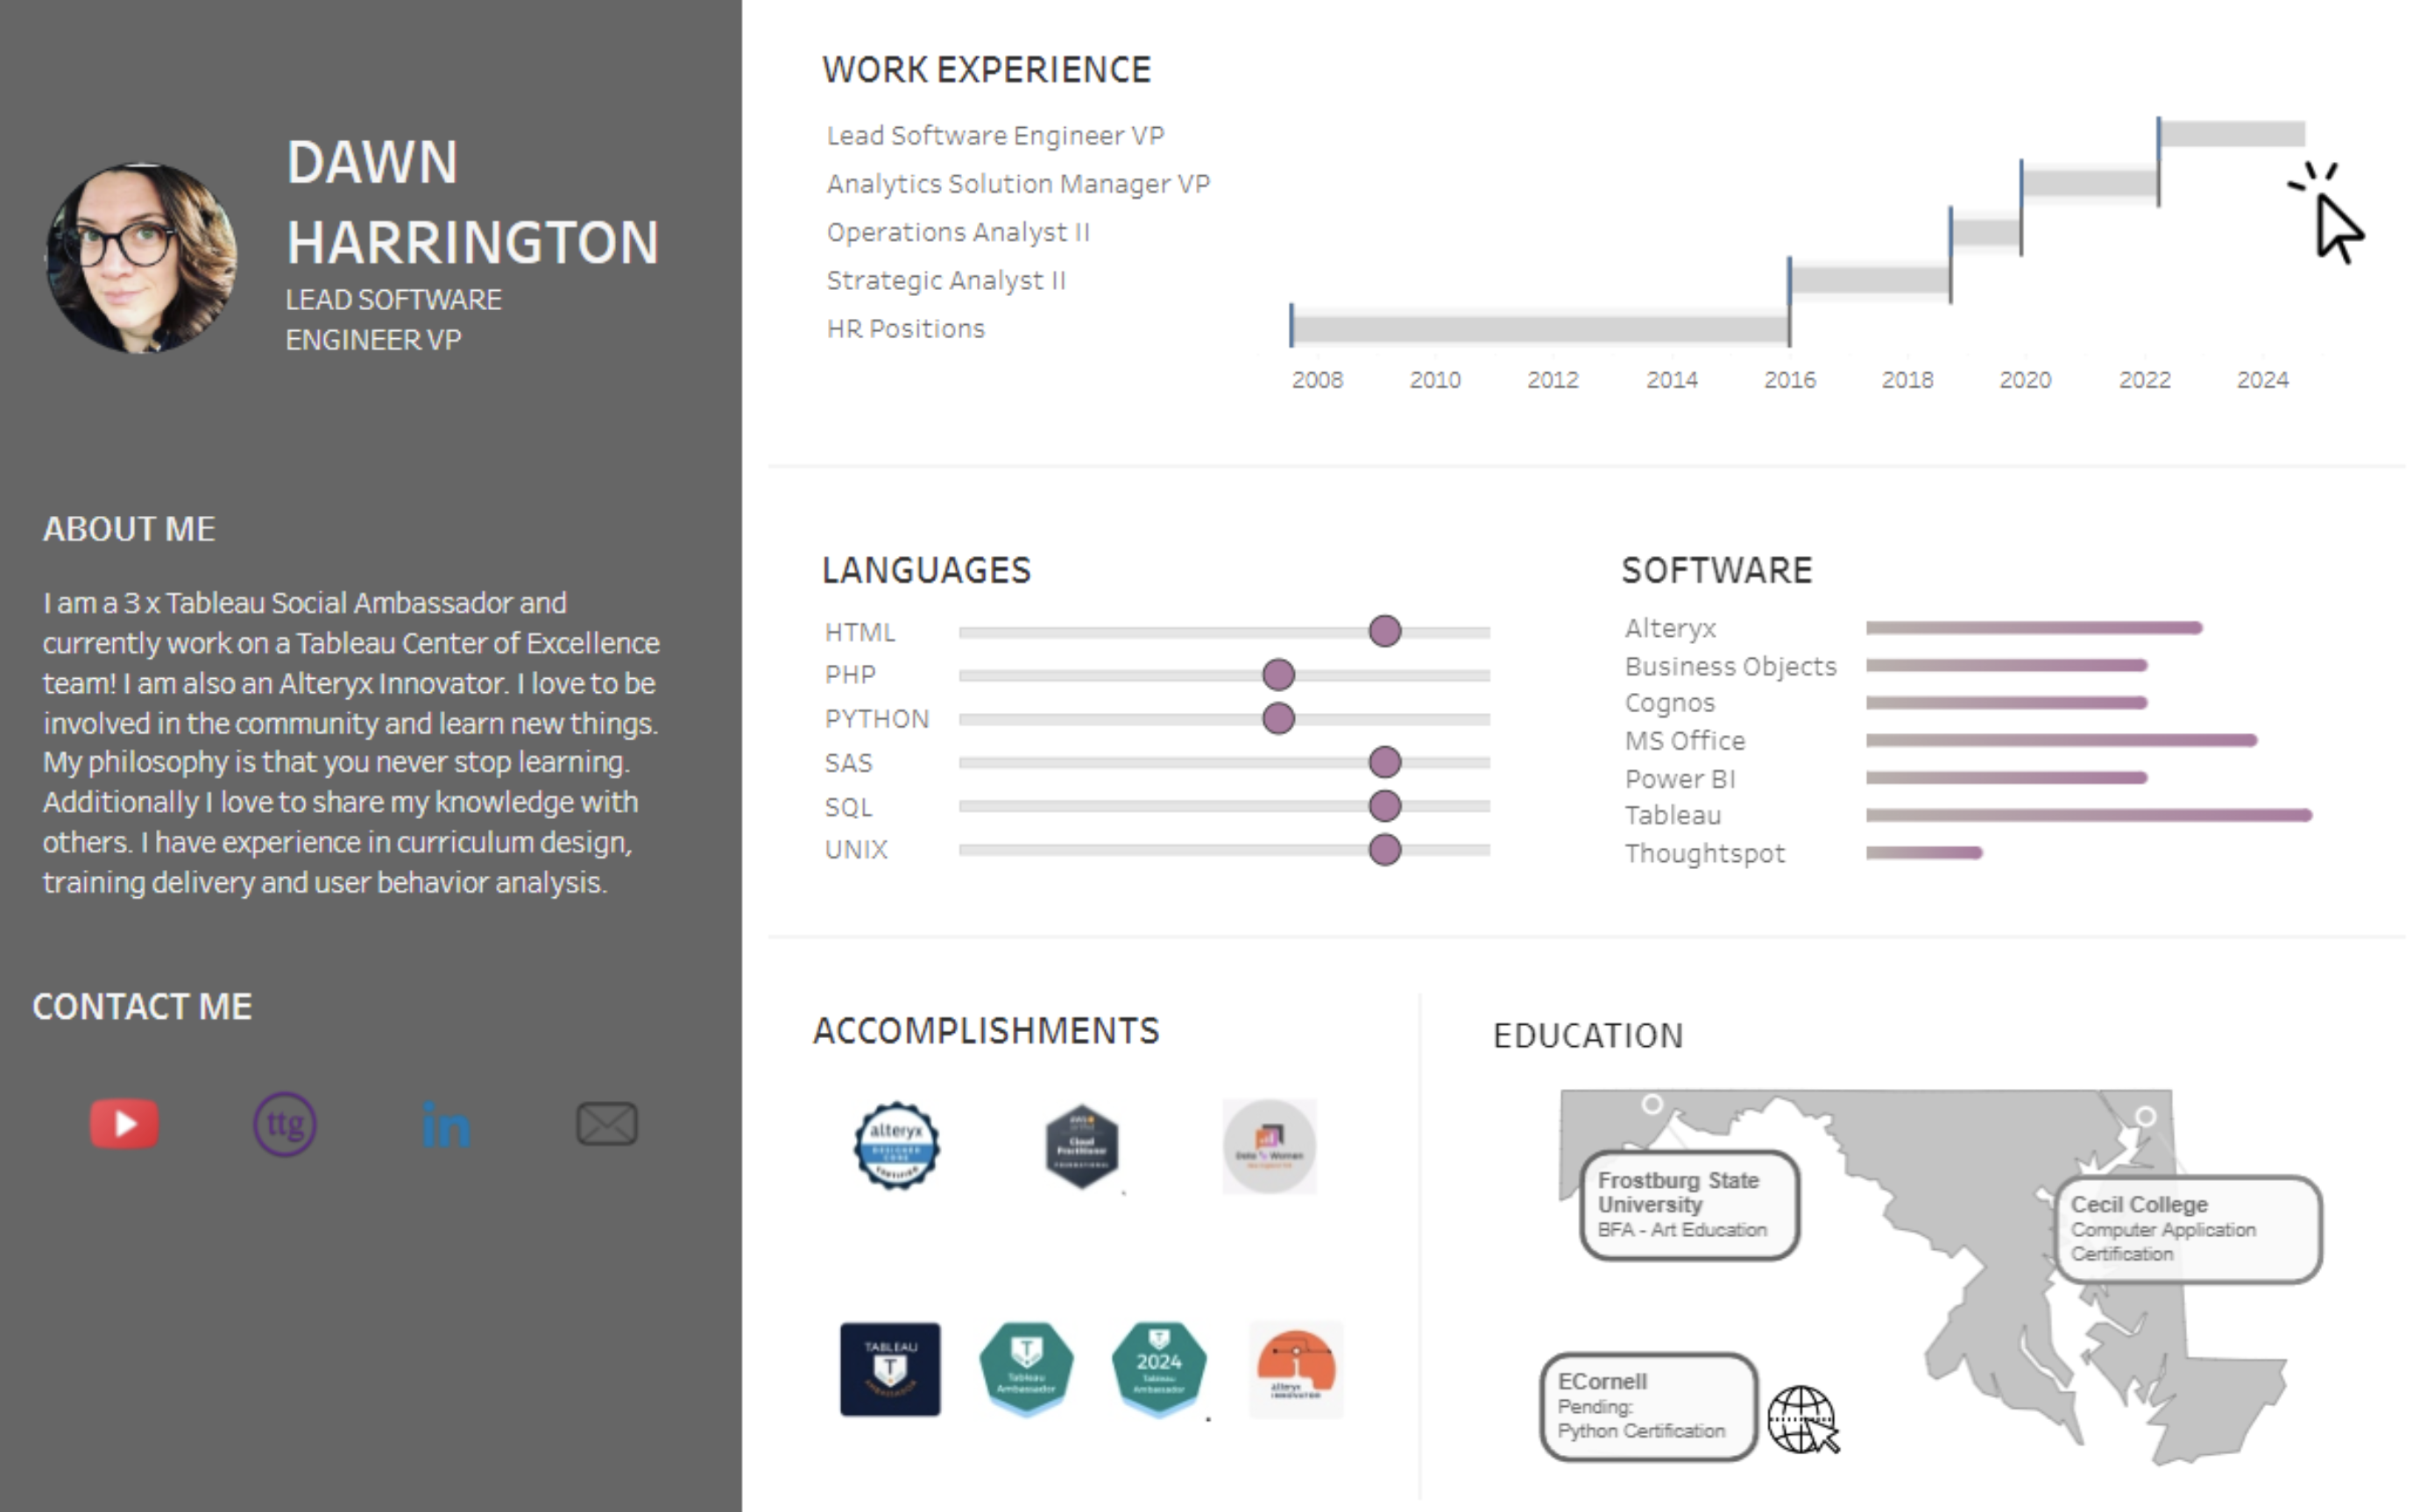
Dawn Harrington, TechTipsGirl: Resumes in Tableau?
Dive into content created by the Tableau Community:
- Aanchal Soni: Trend Chart & Summary Table | Real-time project use cases | Developer Tips
- Jennifer Dawes:
- Dawn Harrington, TechTipsGirl: Resumes in Tableau?
- Ojoswi Basu: Tableau Nested Table Calcs Rank & Totals
- Deepak Holla: Understanding Tableau Concepts: Explain the difference between dimensions and measures
DataFam content
- Data Literacy Basics Everyone Should Know
- Iron Viz 2024: Behind the Build featuring Chris Westlake
- Iron Viz 2024: Behind the Build featuring Pata Gogová
- Iron Viz 2024: Behind the Build featuring Jessica Moon
- Authors available for hire on Tableau Public
- 5 Tips from a Data Career Mentor
- Winning with Tableau: Paul Ross’s Tips from Beginner to Iron Viz Champion
Upcoming events and community participation
- Dreamforce 2024 Happy Hour Event
- Dreamin' in Data Dreamin’ in Data is the first Salesforce Community Conference purpose-built to help showcase the entire journey of your organization’s data, from Salesforce (your CRM), through integrations with other applications (using MuleSoft), and finally to analysis and determining the story your data is telling (using Tableau) – ultimately to help your organization make smarter decisions faster and stay ahead of your competition.
- Mark your calendars and join the Data Book Club as we explore, Chart Spark by Alli Torban, and the book's key themes and practical applications in our professional and personal lives. We will be meeting virtually starting August 2nd at 11am CT, but we also have a Slack space to discuss the book asynchronously as well as share notes, ideas, and resources!
- CRM Analytics Community Office Hours! Have CRM Analytics questions? Want to know how to work with data? Want to learn something new? Have visualization ideas you want to share or need feedback on? Want to just hang out with a bunch of us? Come join us (virtual)!
- DataFam Birthday Roundup! In the effort of continuing support for one another, we thought it would be fun to gather data on DataFam birthdays! If you're willing, could you let us know which day you celebrate your birthday? Just go ahead and pick the day from this year's calendar, since it's a leap year and all possible days are available to choose from!
- Mentorship Program by the Data Visualization Society
- Women in Dataviz Virtual Coffee Breaks: Held every sixth Thursday morning and every sixth Wednesday afternoon in the EST time zone, Virtual Coffee Breaks are a casual networking event. Feel free to drop in and out as you need toduring the hour, and stay for as little time or as long as you want.
Visualizations
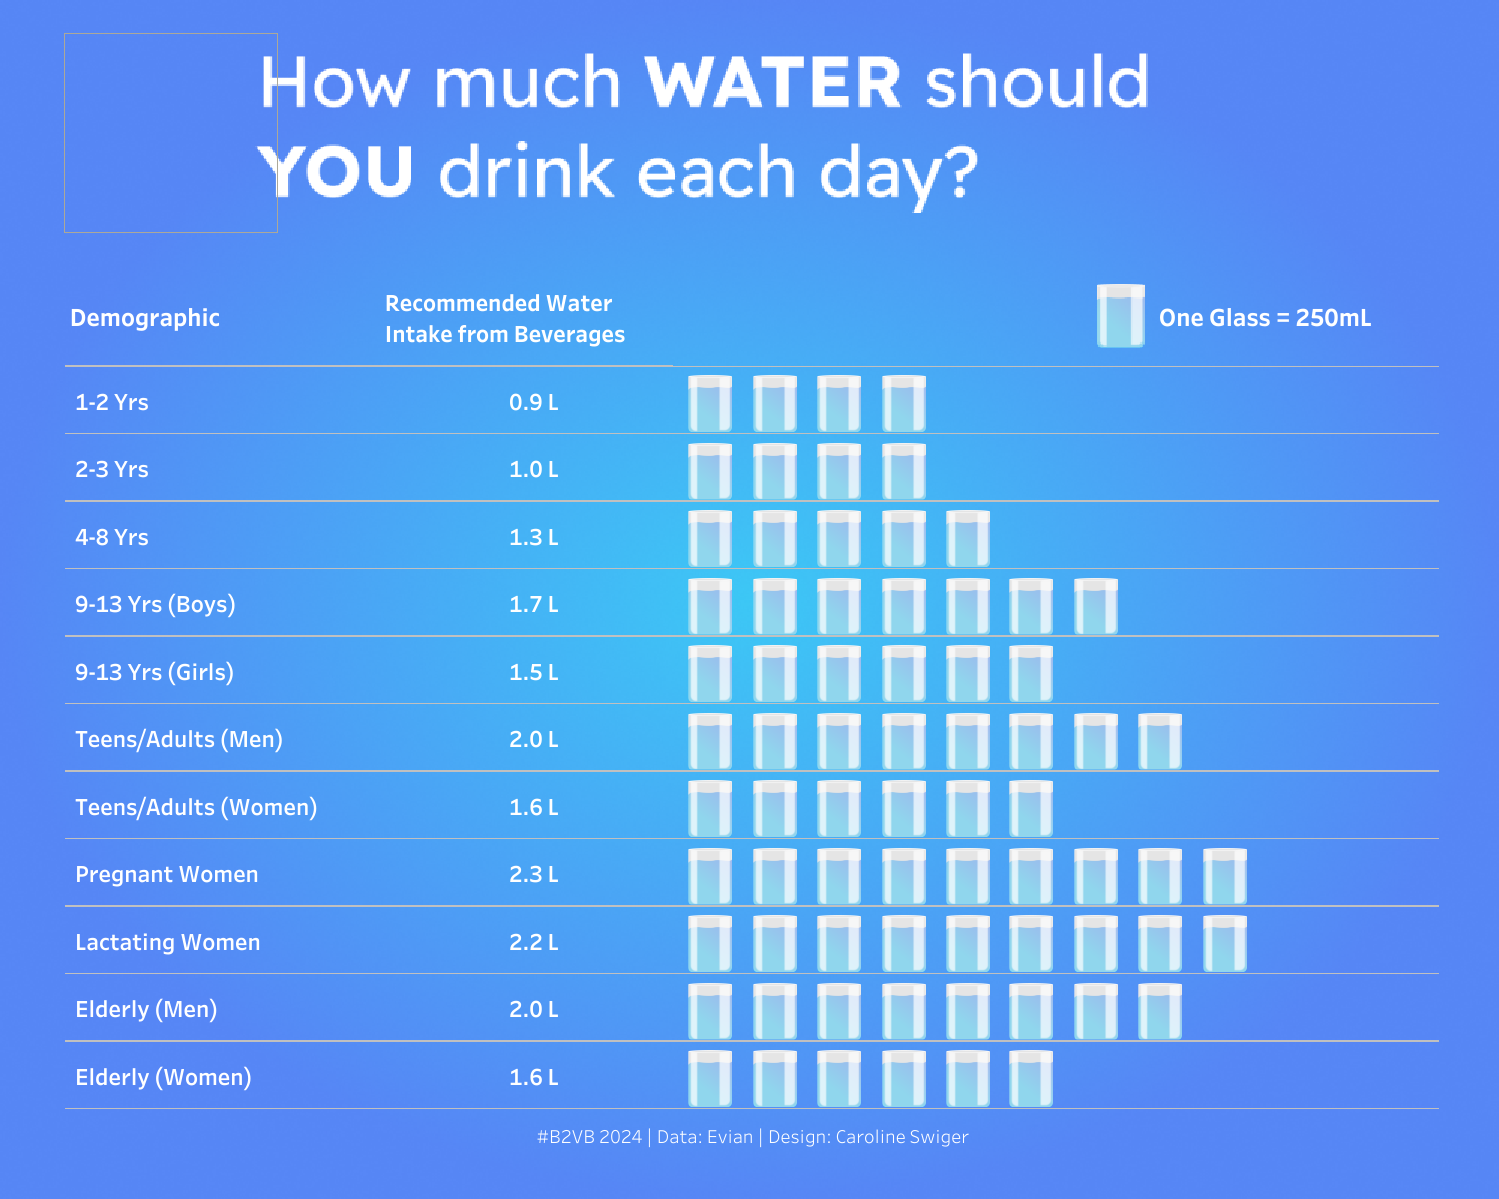
Caroline Swiger: #B2VB 2024: Build a Unit Chart
See the latest Viz of the Day, trending vizzes, featured authors, and more on Tableau Public.
Check out some inspirational vizzes created by the community:
- Tobiloba Babajide: Average Squad Age of Premier League Teams
- Jennifer Dawes:
- Toludoyin Shopein: DataFam Birthday Tracker
- Louis Yu: Lady Of The Moon
- Rob Taylor:
- Enrique Mendoza T. | DatavizAdventure: Video Game Companies
- Caroline Swiger: #B2VB 2024: Build a Unit Chart
- Arshi Saleh London's Poverty and Inequality Profile | #MOM - W38/2024
- Ben Norland: We'll Be Glowing In The Dark
Community Projects
Back 2 Viz Basics
A bi-weekly project helping those who are newer in the community and just starting out with Tableau. Not limited just to newbies!
Web: Back 2 Viz Basics
X: #B2VB
Week 18: Build a Bump Chart
Workout Wednesday
Build your skills with a weekly challenge to re-create an interactive data visualization.
Web: Workout Wednesday
X: #WOW2022
Week 37: Can you create multi-select parameters?
Preppin' Data
A weekly challenge to help you learn to prepare data and use Tableau Prep.
Web: Preppin’ Data
X: #PreppinData
Week 38: Preppin' Consultancy Days
Makeover Monday
Create business dashboards using provided data sets for various industries and departments.
Web: Makeover Monday
X: #MakeoverMonday
Week 38: London's Poverty & Inequality Profile
Visual Climate
Collaborate and share climate data.
Web: Visual Climate
X: #VisualClimate
Gender Equality_ Women Entrepreneurship Participation
DataFam Con
A monthly challenge covering pop culture and fandoms.
Web: DataFam Con
X: #DataFamCon
September 2024: Live Long and Prosper with Star Trek
EduVizzers
A monthly project connecting real education data with real people.
Web: Eduvizzers
August 2024: Analyze Boston – Department of Innovation and Technology
Viz for Social Good
Volunteer to design data visualizations that help nonprofits harness the power of data for social change.
Web: Viz for Social Good
X: #VizforSocialGood
: Future Fridays
Games Night Viz
A monthly project focusing on using data from your favorite games.
Web: Games Nights Viz
X: #GamesNightViz
Season 2: Cooking up the Spice of Data
Iron Quest
Practice data sourcing, preparation, and visualization skills in a themed monthly challenge.
Web: Iron Quest
X: #IronQuest
Iron Quest – Maps II
Storytelling with Data
Practice data visualization and storytelling skills by participating in monthly challenges and exercises.
Web: Storytelling with Data
X: #SWDChallenge
July 2024: graphing for—or with—kids
Project Health Viz
Uncover new stories by visualizing healthcare data sets provided each month.
Web: Project Health Viz
X: #ProjectHealthViz
Diversity in Data
An initiative centered around diversity, equity & awareness by visualizing provided datasets each month.
Web: Diversity in Data
X: #DiversityinData
Sports Viz Sunday
Create and share data visualizations using rich, sports-themed data sets in a monthly challenge.
Web: Sports Viz Sunday
X: #SportsVizSunday
Real World Fake Data
Create business dashboards using provided data sets for various industries and departments.
Web: Real World Fake Data
X: #RWFD
2024 - Admin Insights
Data Plus Music
A monthly project visualizing the data behind the music we love!
Web: Data Plus Music
X: #DataPlusMusic
Historias relacionadas

DataFam Roundup: February 24-28, 2025

DataFam Roundup: February 17-21, 2025

DataFam Roundup: February 10-14, 2025
Suscribirse a nuestro blog
Obtén las últimas actualizaciones de Tableau en tu bandeja de entrada.