DataFam Roundup: November 25-December 6, 2024
Welcome! Dig into this week's DataFam Roundup—a weekly blog that brings together community content all in one post. As always, we invite you to send us your content—and the DataFam content from your peers that have inspired you! Find the content submission form here.
Community Highlight
To recognize new and consistent Tableau contributors—we’re excited to have a section within the weekly DataFam Roundup called the Tableau Community Highlight. Find out how to get involved.

Shane Turbeville, Senior Business Intelligence Engineer at The Kraft Heinz Company
Indiana, USA
Shane Turbeville is a Senior Business Intelligence Engineer at The Kraft Heinz Company. He discovered Tableau while working as a Geospatial Analyst for the Indiana University Public Policy Institute. Previously in this role, Shane primarily worked with ArcGIS but noticed another researcher using Tableau, which seemed to open up more doors to really explore the data. After trying out Tableau for himself, he loved that he could dig in and pull deeper insights. Now, Shane is involved in the Tableau Community through the Indianapolis Tableau User Group, publishing vizzes on Tableau Public, and sharing his knowledge on social media.
In addition to his participation in various areas of the community, Shane has also created resources for people learning Tableau. The goal of his Tableau Chart Guide is to provide inspiration and tutorials for people to use when building out a new chart, and explore new ways to analyze their data. Check it out here.
Connect with Shane on Linkedin, X, and Tableau Public.
DataFam content

Yash Sakhuja: Timeline Slope for Cricket featured in Scraping Ball-by-Ball Cricket Data
Dive into content created by the Tableau Community:
- Sarah Pallett: Tableau 2024.3: Tableau Table
- CJ Mayes and Yash Sakhuja: Scraping Ball-by-Ball Cricket Data
- Deepak Holla: Understanding Tableau Viz LOD
- Bridget Cogley: Rants on Literacies
- Johan de Groot: DataFam Europe 2024 review
- The Information Lab: Conditional Formatting in Tables in Tableau
- Alexander Mou: Creating In-Place Help Page for Tableau Dashboard
- her data: Tableau Data Art Gallery
- Louis Yu
- Secrets of the Viz: Wellerman #IronViz featuring Ann Pregler
- Secrets of the Viz: Pokémon Nuzlockes #IronViz featuring Blake Feiza
Team Tableau content
Upcoming events and community participation
- Chart Chat Round 56 -- Charts on TV: Virtual Event, Dec 12, 2024, 11:00 AM (EST) - The December Chart Chat is all about charts seen in TV shows. This episode will dig into charts that are pivotal to a show's plot and narrative.
- Apply or Nominate the 2025 Tableau Visionaries (survey)
- Iron Viz 2025: Qualifier Results: Virtual Event, Jan 14, 2025, 9:00 AM (PT) - The results are in! Iron Viz hosts, Andy Cotgreave and Archana Ganeshalingam will announce the Top 10 scoring entries from this year's Qualifiers, including the 3 Finalists headed to the Iron Viz Championship at Tableau Conference 2025.
Visualizations

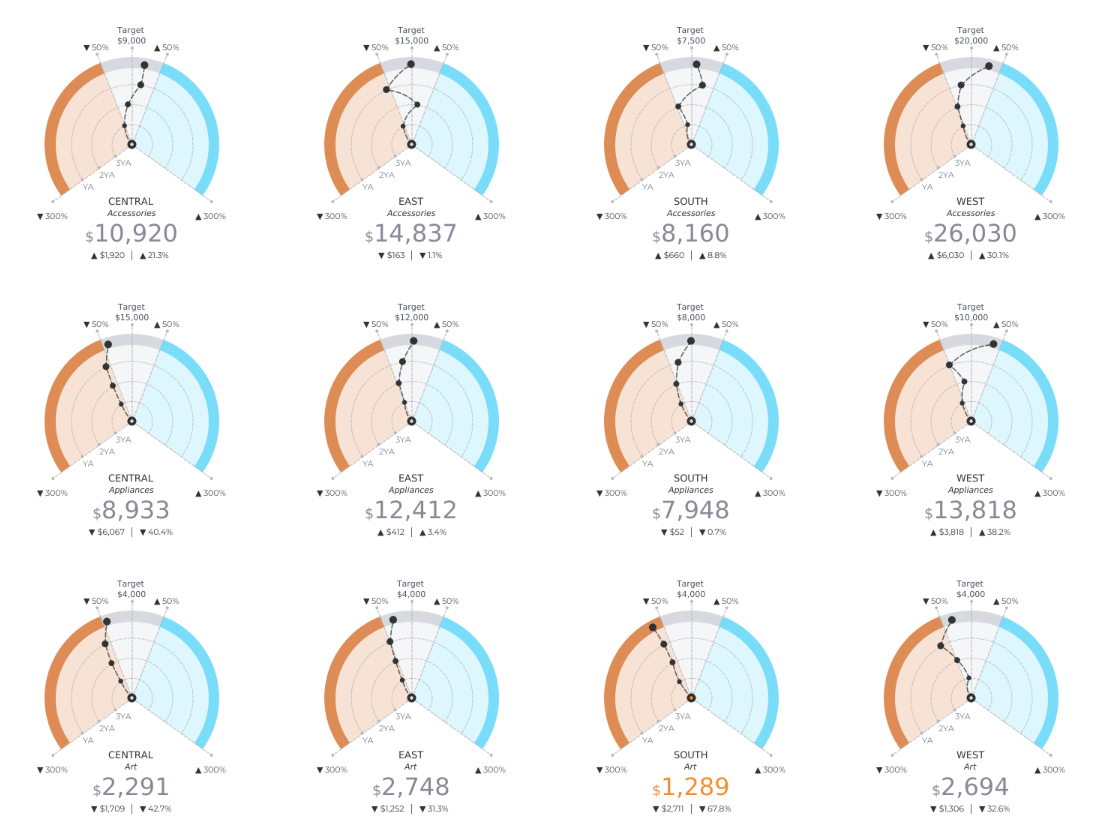
Sam Parsons: Drunken Gauge Design
See the latest Viz of the Day, trending vizzes, featured authors, and more on Tableau Public.
Check out some inspirational vizzes created by the community:
- P A T H | We Are Data People: Tourism in Brazil
- Akane Okamoto: Towards a World Without Torture | #VizforSocialGood
- Rebecca Deng: Stranger Things Analysis | #DataPlusTV
- Nikki Perry: Preventing Torture, Protecting Humanity | #VizforSocialGood
Community Projects
Back 2 Viz Basics
A bi-weekly project helping those who are newer in the community and just starting out with Tableau. Not limited just to newbies!
Web: Back 2 Viz Basics
X: #B2VB
Workout Wednesday
Build your skills with a weekly challenge to re-create an interactive data visualization.
Web: Workout Wednesday
X: #WOW2022
Preppin' Data
A weekly challenge to help you learn to prepare data and use Tableau Prep.
Web: Preppin’ Data
X: #PreppinData
Makeover Monday
Create business dashboards using provided data sets for various industries and departments.
Web: Makeover Monday
X: #MakeoverMonday
Visual Climate
Collaborate and share climate data.
Web: Visual Climate
X: #VisualClimate
DataFam Con
A monthly challenge covering pop culture and fandoms.
Web: DataFam Con
X: #DataFamCon
EduVizzers
A monthly project connecting real education data with real people.
Web: Eduvizzers
Viz for Social Good
Volunteer to design data visualizations that help nonprofits harness the power of data for social change.
Web: Viz for Social Good
X: #VizforSocialGood
Games Night Viz
A monthly project focusing on using data from your favorite games.
Web: Games Nights Viz
X: #GamesNightViz
Iron Quest
Practice data sourcing, preparation, and visualization skills in a themed monthly challenge.
Web: Iron Quest
X: #IronQuest
Storytelling with Data
Practice data visualization and storytelling skills by participating in monthly challenges and exercises.
Web: Storytelling with Data
X: #SWDChallenge
Project Health Viz
Uncover new stories by visualizing healthcare data sets provided each month.
Web: Project Health Viz
X: #ProjectHealthViz
Diversity in Data
An initiative centered around diversity, equity & awareness by visualizing provided datasets each month.
Web: Diversity in Data
X: #DiversityinData
Sports Viz Sunday
Create and share data visualizations using rich, sports-themed data sets in a monthly challenge.
Web: Sports Viz Sunday
X: #SportsVizSunday
Real World Fake Data
Create business dashboards using provided data sets for various industries and departments.
Web: Real World Fake Data
X: #RWFD
Data Plus Music
A monthly project visualizing the data behind the music we love!
Web: Data Plus Music
X: #DataPlusMusic
Historias relacionadas
Suscribirse a nuestro blog
Obtén las últimas actualizaciones de Tableau en tu bandeja de entrada.


