DataFam Roundup: June 24–28, 2024


Welcome! Dig into this week's DataFam Roundup—a weekly blog that brings together community content all in one post. As always, we invite you to send us your content—and the DataFam content from your peers that have inspired you! Find the content submission form here.
Community Highlight
To recognize new and consistent Tableau contributors—we’re excited to have a section within the weekly DataFam Roundup called the Tableau Community Highlight. Find out how to get involved.

Weronika Gawarska-Tywonek, Data Visualization Designer
Warsaw, Poland
Weronika Gawarska-Tywonek is a Data Visualization Designer. She uses Tableau to translate business requirements into insightful data visualizations. Her process begins with pen and paper to sketch initial concepts, followed by detailed designs in Figma. Tableau then brings these designs to life, enabling the creation of interactive and informative dashboards.
As a leader of the Poland Tableau User Group, Weronika hopes to create a local community where Tableau users can share experiences and best practices. Weronika is also sharing her knowledge through sharing Tableau courses she created driven by her desire to help others navigate their challenges, serving as a jury member for the Make Your Data Speak competition, where she evaluated innovative data visualizations, and writing blog posts about best practices for data visualization, and sharing insights and tips to help others enhance their skills.
Connect with Weronika on Linkedin, Tableau Public, and on her blog.
DataFam content
Dive into content created by the Tableau Community:
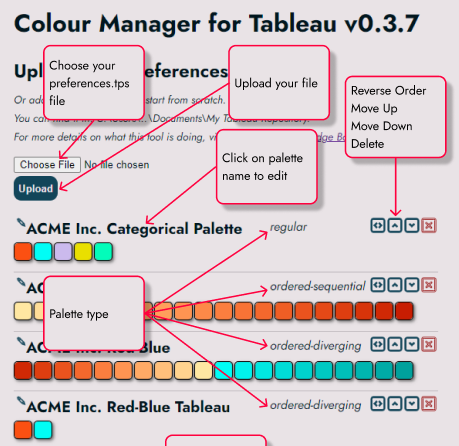
Alex Waleczek, VizKu: Colour Manager for Tableau
- Tim Ngwena and Tristan Guillevin: Tableau Tim, New Native Chart types in Tableau | Viz Extensions Deep Dive
- DataEve: Hack to any Tableau Date Calculation Problem
- Brian Moore: Advanced What-If Analysis in Tableau
- Merav Yuravlivker, The Data Leadership Collaborative: Creating a Data Governance Culture
- Kyle Massey: Pride + Coming Out: My Story and Perspective
- Louis Yu: Stanislaw Lem
- Branden Kornell: Tableau’s Annoying “Aggregate and Non-Aggregate” Error, Explained with Excel
- Anya Prosvetova: Building an Investment Portfolio Optimisation Tool with Python and Table Extensions in Tableau
- Kirk Munroe, The Flerlage Twins: New in Tableau 2024.2 – Shared Dimensions
- Deepak Holla: How do the properties in the Marks card vary
- Chris Westlake: Iron Viz | A Spotlight on Storytelling — Westlake Analytics
- Alex Waleczek, VizKu: Colour Manager for Tableau
- Storytelling with Data: charts and graphs - a complete guide
- Brittany Rosenau: 5 Quick Questions about Tableau Ambassador Nominations
- Lisa Trescott: At the Speed of Iron Viz
Team Tableau
- Tableau Ambassador nominations and applications are open
- Data, Diversity, and Pride: Honoring the LGBTQ+ Community on Tableau Public
- Tableau Public Featured Authors: June 2024
- Tableau+: New Edition with Premium AI, Enterprise Capabilities, and Premier Success
- Your Questions Answered: Highlights from Q&A at Tableau Conference 2024
Upcoming events and community participation
- CRM Analytics Community Office Hours! Have CRM Analytics questions? Want to know how to work with data? Want to learn something new? Have visualization ideas you want to share or need feedback on? Want to just hang out with a bunch of us? Come join us (virtual)!
- Lights, Camera, Action: Tableau and IMDb Launch Data Visualization Campaign for Movie Lovers
- DataFam Birthday Roundup! In the effort of continuing support for one another, we thought it would be fun to gather data on DataFam birthdays! If you're willing, could you let us know which day you celebrate your birthday? Just go ahead and pick the day from this year's calendar, since it's a leap year and all possible days are available to choose from!
- Mentorship Program by the Data Visualization Society
- Women in Dataviz Virtual Coffee Breaks: Held every sixth Thursday morning and every sixth Wednesday afternoon in the EST time zone, Virtual Coffee Breaks are a casual networking event. Feel free to drop in and out as you need toduring the hour, and stay for as little time or as long as you want.
Vizzes
See the latest Viz of the Day, trending vizzes, featured authors, and more on Tableau Public.
Check out some inspirational vizzes created by the community:
- Anamika Satsangi: Deaths Due to Natural Causes #MakeoverMonday
- Satoshi Ganeko: #B2VB 2024/Week 12 - Use Annotations Effectively
- Serena Purslow: Death from Natural Disasters | Makeover Monday 2024 w25
- Jennifer Dawes: Presidential Survey
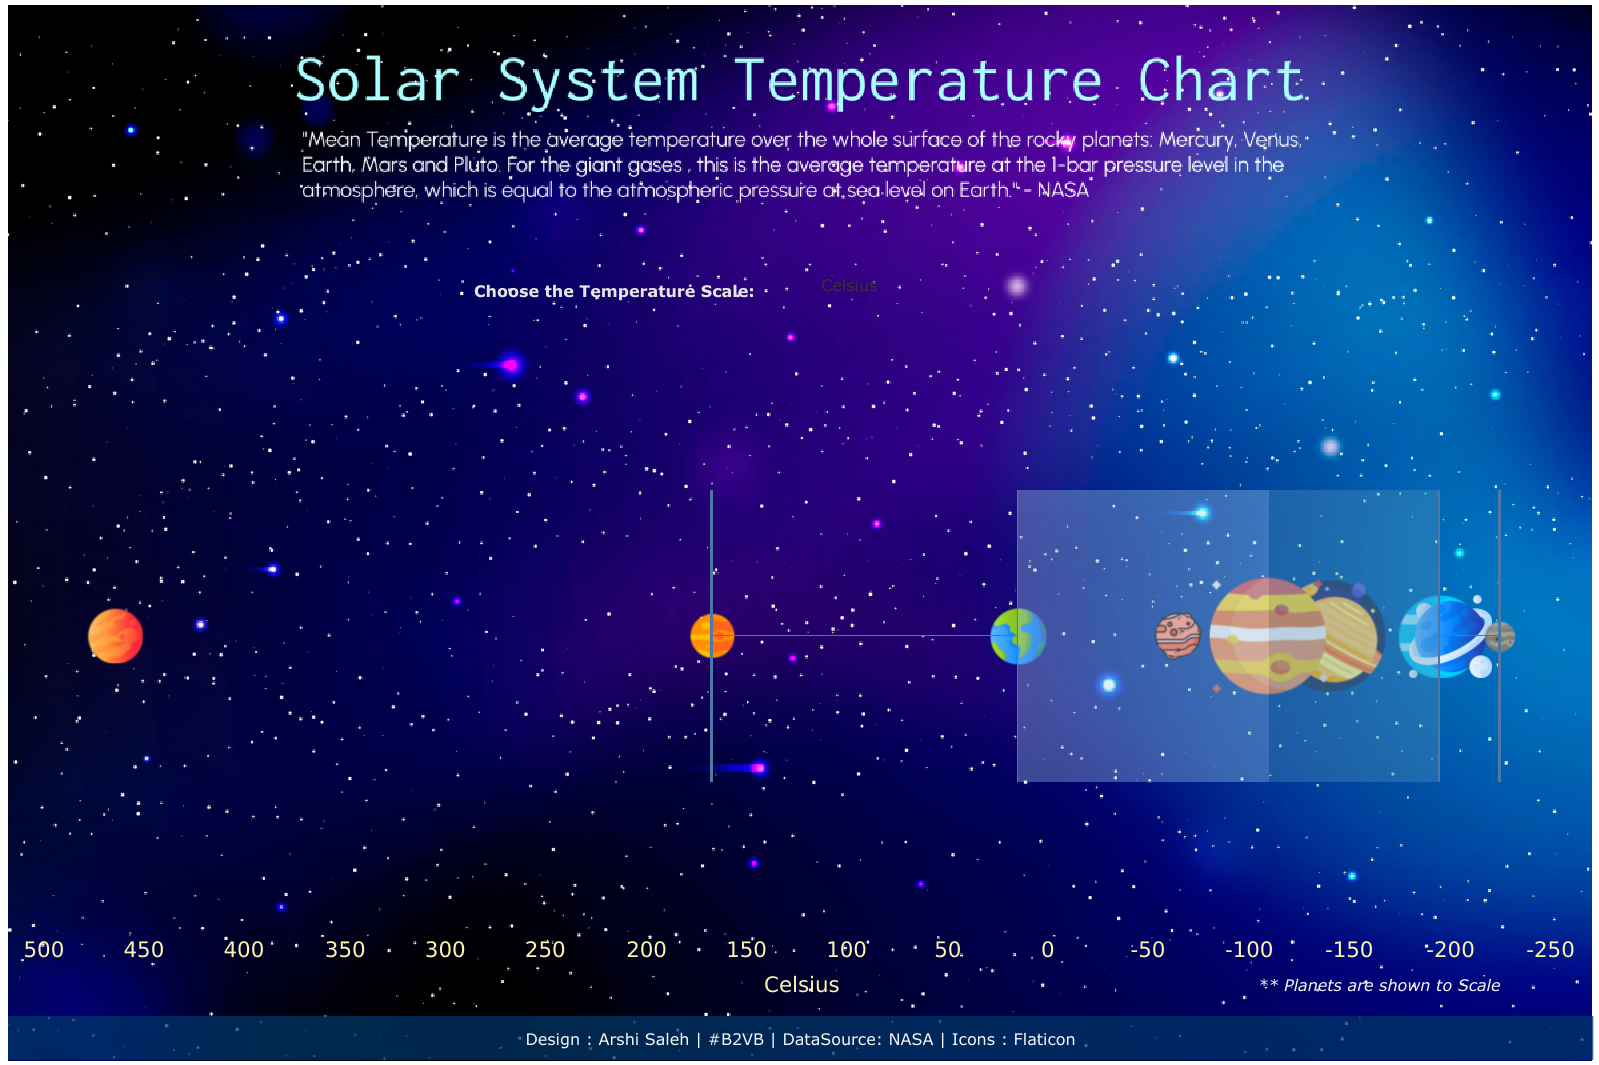
- Jonathan Akpogbo Chris: Mean Temperatures of Planets | #B2VB
- Chasoso (Hideaki Yamamoto): #B2VB 2024 Week 13 | Are There Other Habitable Planets in the Solar System?
- Ryan Soares: Euro 2024 | The Perfect Tournament
- Arshi Saleh: Solar System Surface Temperatures | #B2VB | Box and Whisker Plot
- Nayeli Jaime: Mental Health Resources in NYC
- Waqar Ahmed Shaikh: Global CO2 Emissions
- Doug Wallace: The Nike "Blue Ice" Dashboard (Executive Style Dashboard)
Community Projects
Back 2 Viz Basics
A bi-weekly project helping those who are newer in the community and just starting out with Tableau. Not limited just to newbies!
Web: Back 2 Viz Basics
X: #B2VB
Week 13: Build a Box & Whisker Plot
Workout Wednesday
Build your skills with a weekly challenge to re-create an interactive data visualization.
Web: Workout Wednesday
X: #WOW2022
Week 26: Can you filter from a donut without highlighting the pie?
Preppin' Data
A weekly challenge to help you learn to prepare data and use Tableau Prep.
Web: Preppin’ Data
X: #PreppinData
Week 26: SuperBytes Customer Complaints Part 2
Makeover Monday
Create business dashboards using provided data sets for various industries and departments.
Web: Makeover Monday
X: #MakeoverMonday
Week 26: UEFA EURO 2024 - statistics & facts
DataFam Con
A monthly challenge covering pop culture and fandoms.
Web: DataFam Con
X: #DataFamCon
March 2024 Challenge: Sports Movies Edition
EduVizzers
A monthly project connecting real education data with real people.
Web: Eduvizzers
June 2024: Data + Movies + Education (IMDB)
Viz for Social Good
Volunteer to design data visualizations that help nonprofits harness the power of data for social change.
Web: Viz for Social Good
X: #VizforSocialGood
Games Night Viz
A monthly project focusing on using data from your favorite games.
Web: Games Nights Viz
X: #GamesNightViz
Season 2: Cooking up the Spice of Data
Iron Quest
Practice data sourcing, preparation, and visualization skills in a themed monthly challenge.
Web: Iron Quest
X: #IronQuest
Women
Storytelling with Data
Practice data visualization and storytelling skills by participating in monthly challenges and exercises.
Web: Storytelling with Data
X: #SWDChallenge
June 2024: make a funnel chart
Project Health Viz
Uncover new stories by visualizing healthcare data sets provided each month.
Web: Project Health Viz
X: #ProjectHealthViz
Diversity in Data
An initiative centered around diversity, equity & awareness by visualizing provided datasets each month.
Web: Diversity in Data
X: #DiversityinData
Sports Viz Sunday
Create and share data visualizations using rich, sports-themed data sets in a monthly challenge.
Web: Sports Viz Sunday
X: #SportsVizSunday
Real World Fake Data
Create business dashboards using provided data sets for various industries and departments.
Web: Real World Fake Data
X: #RWFD
2024 - Admin Insights
Data Plus Music
A monthly project visualizing the data behind the music we love!
Web: Data Plus Music
X: #DataPlusMusic
Historias relacionadas

DataFam Roundup: February 24-28, 2025

DataFam Roundup: February 17-21, 2025

DataFam Roundup: February 10-14, 2025
Suscribirse a nuestro blog
Obtén las últimas actualizaciones de Tableau en tu bandeja de entrada.