It’s important to note that this is a very modern definition of business intelligence – and BI has had a strangled history as a buzzword. Traditional Business Intelligence, capital letters and all, originally emerged in the 1960s as a system of sharing information across organisations. It further developed in the 1980s alongside computer models for decision-making and turning data into insights before becoming a specific offering from BI teams with IT-reliant service solutions.
Modern BI solutions prioritise flexible self-service analysis, governed data on trusted platforms, empowered business users and speed to insight. This article will serve as an introduction to BI and is the tip of the iceberg.
How business intelligence works
Businesses and organisations have questions and goals. To answer these questions and track performance against these goals, they gather the necessary data, analyse it and determine which actions to take to reach their goals.

On the technical side, raw data is collected from the business’ activity. Data is processed and then stored in data warehouses. Once it’s stored, users can then access the data, starting the analysis process to answer business questions.
How BI, data analytics, and business analytics work together
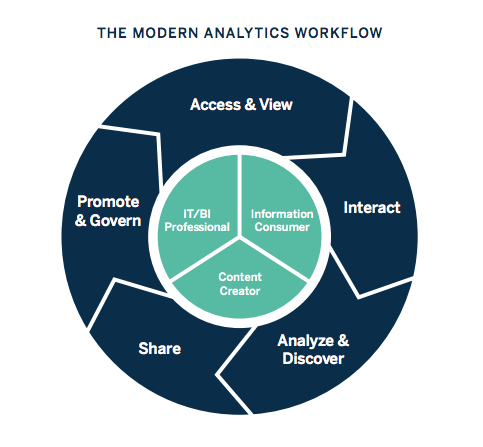
Business intelligence includes data analytics and business analytics, but uses them only as parts of the whole process. BI helps users draw conclusions from data analysis. Data scientists dig into the specifics of data, using advanced statistics and predictive analytics to discover patterns and forecast future patterns. Data analytics asks “Why did this happen and what can happen next?” Business intelligence takes those models and algorithms and breaks the results down into actionable language. According to Gartner's IT glossary, “business analytics includes data mining, predictive analytics, applied analytics and statistics.” In short, organisations conduct business analytics as part of their larger business intelligence strategy. BI is designed to answer specific queries and provide at-a-glance analysis for decisions or planning. However, companies can use the processes of analytics to continually improve follow-up questions and iteration. Business analytics shouldn’t be a linear process, because answering one question will likely lead to follow-up questions and iteration. Rather, think of the process as a cycle of data access, discovery, exploration and information sharing. This is called the cycle of analytics, a modern term explaining how businesses use analytics to react to changing questions and expectations.
The difference between traditional BI and modern BI

Modern BI prioritises self-service analytics and speed to insight.
Historically, business intelligence tools were based on a traditional business intelligence model. This was a top-down approach where business intelligence was driven by the IT organisation and most, if not all, analytics questions were answered through static reports. This meant that if someone had a follow-up question about the report they received, their request would go to the bottom of the reporting queue and they would have to start the process over again. This led to slow, frustrating reporting cycles and people weren’t able to make use of current data to make decisions. Traditional business intelligence is still a common approach for regular reporting and answering static queries. However, modern business intelligence is interactive and approachable. While IT departments are still an important part of managing access to data, multiple levels of users can customise dashboards and create reports with little notice. With the proper software, users are empowered to visualise data and answer their own questions.
Why is business intelligence important?

Great BI helps businesses and organisations ask and answer questions of their data.
Business intelligence can help companies make better decisions by showing present and historical data within their business context. Analysts can use BI to provide performance and competitor benchmarks to make the organisation run smoother and more efficiently. Analysts can also more easily spot market trends to increase sales or revenue. Used effectively, the right data can help with anything from compliance to hiring efforts. A few ways that business intelligence can help companies make smarter, data-driven decisions:
- Identify ways to increase profit
- Analyse customer behaviour
- Compare data with competitors
- Track performance
- Optimise operations
- Predict success
- Spot market trends
- Discover issues or problems
Examples of business intelligence

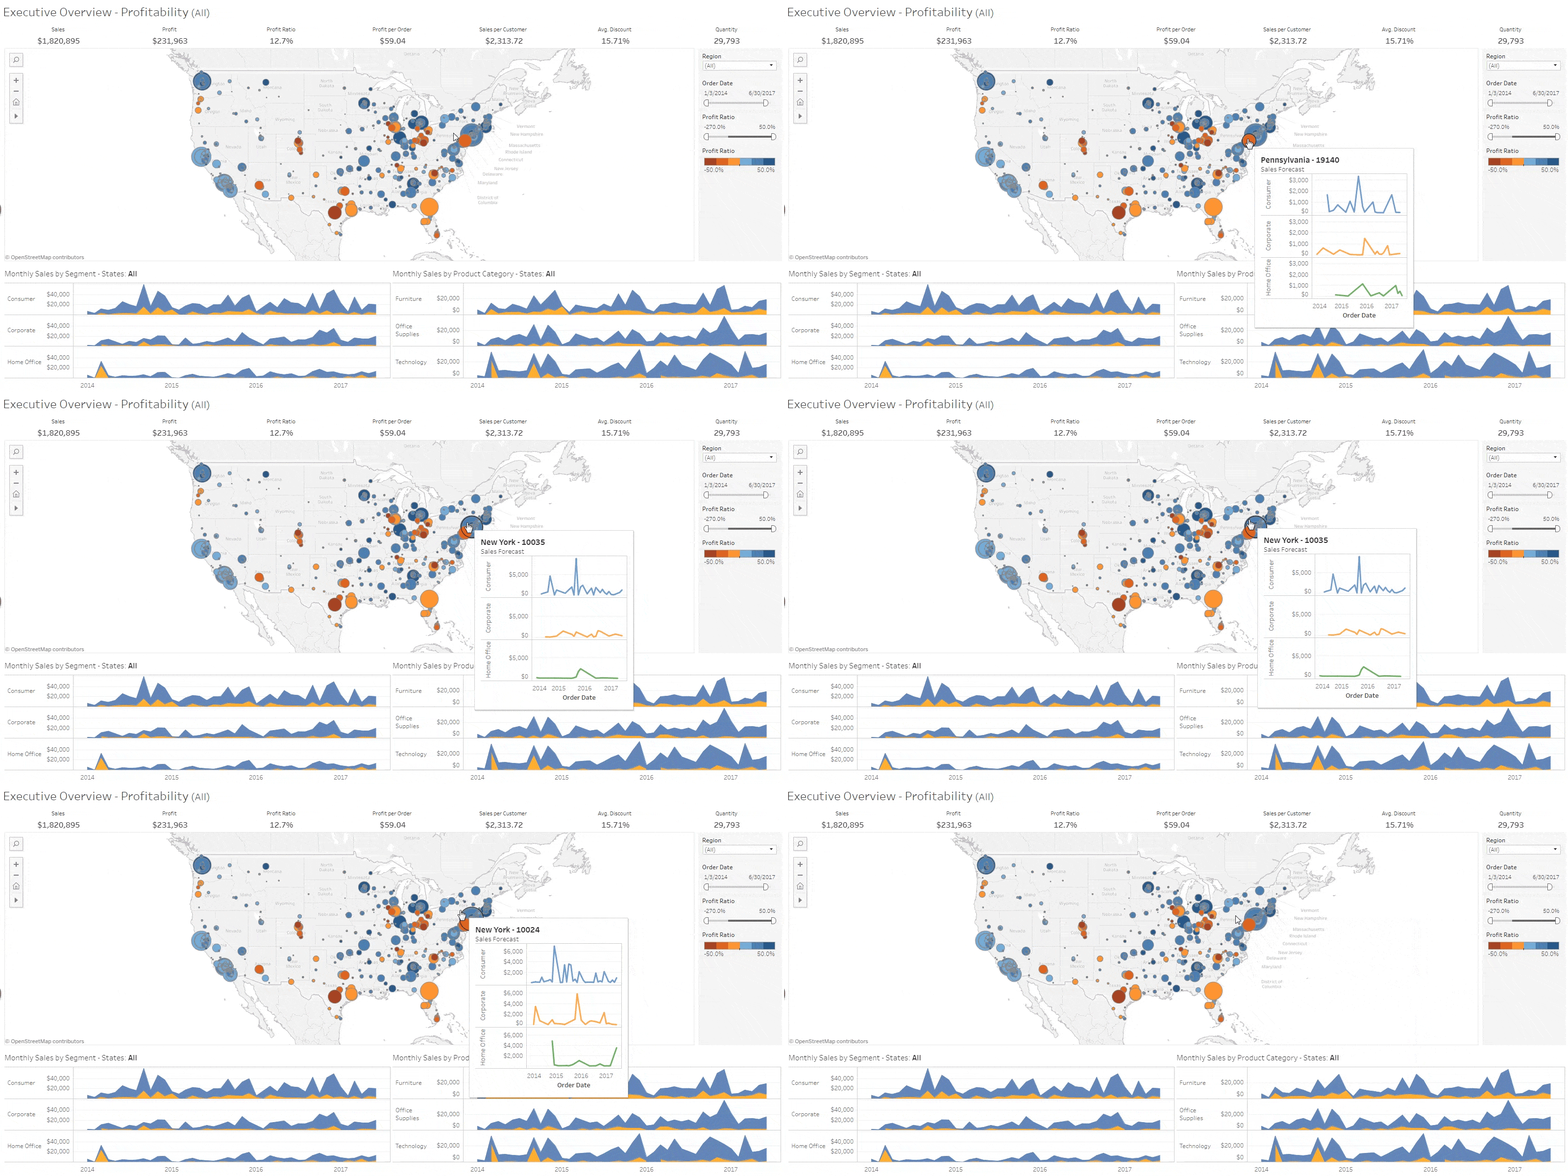
Tableau's Explain Data feature helps to quickly identify possible explanations of outliers and trends in data.
Much more than a specific “thing”, business intelligence is rather an umbrella term that covers the processes and methods of collecting, storing and analysing data from business operations or activities to optimise performance. All of these things come together to create a comprehensive view of a business to help people make better, actionable decisions. Over the past few years, business intelligence has evolved to include more processes and activities to help improve performance. These processes include:
- Data mining: Using databases, statistics and machine learning to uncover trends in large datasets.
- Reporting: Sharing data analysis with stakeholders so they can draw conclusions and make decisions.
- Performance metrics and benchmarking: Comparing current performance data to historical data to track performance against goals, typically using customised dashboards.
- Descriptive analytics: Using preliminary data analysis to find out what happened.
- Querying: Asking the data specific questions, BI pulling the answers from the datasets.
- Statistical analysis: Taking the results from descriptive analytics and further exploring the data using statistics, such as how this trend happened and why.
- Data visualisation: Turning data analysis into visual representations such as charts, graphs and histograms to more easily consume data.
- Visual analysis: Exploring data through visual storytelling to communicate insights on the fly and stay in the flow of analysis.
- Data preparation: Compiling multiple data sources, identifying the dimensions and measurements, preparing it for data analysis.
There are also many examples of big-name companies using business intelligence to increase their impact which you can read about to better understand its application.
How major industries use business intelligence

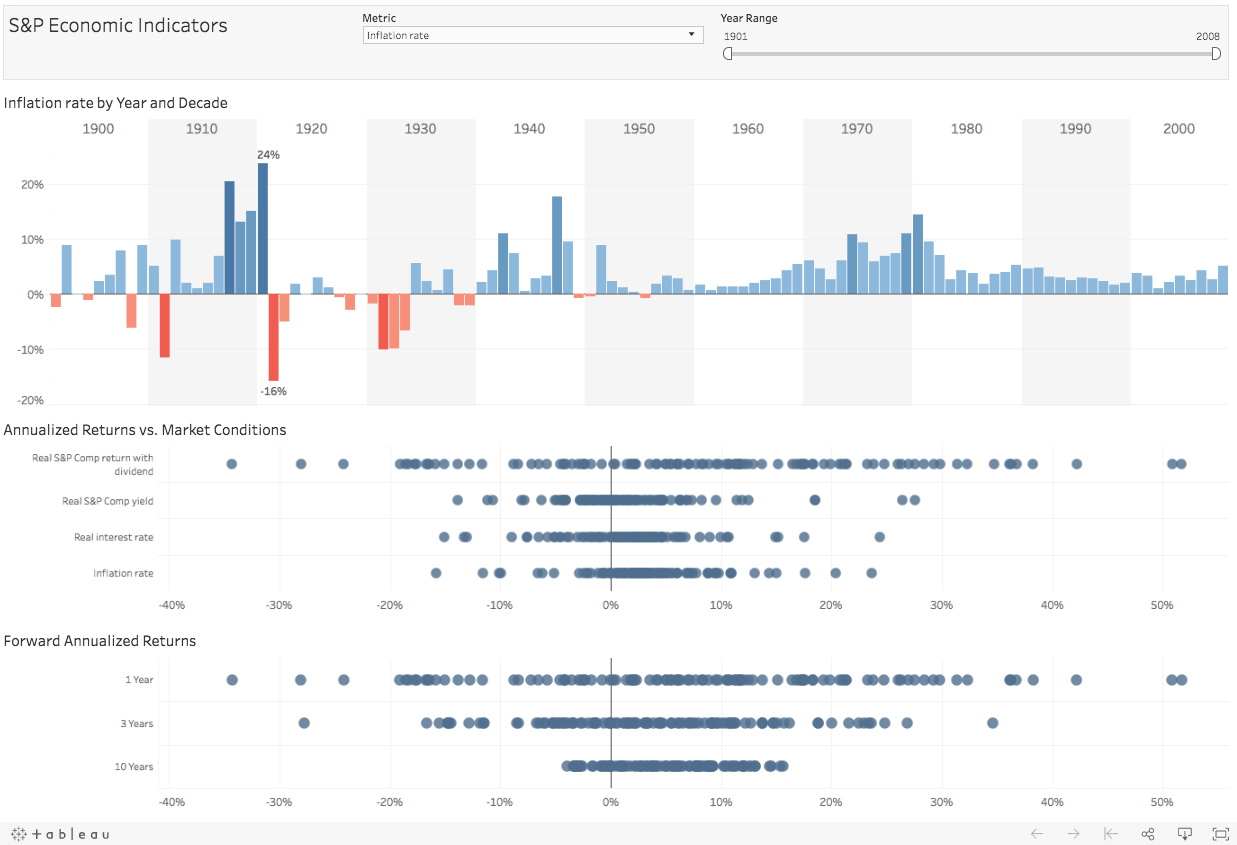
Example of an economic indicators dashboard, showing the long-term drivers of the US economy.
Many disparate industries have adopted BI ahead of the curve, including healthcare, information technology and education. All organisations can use data to transform their operations. Financial services firm Charles Schwab used business intelligence to see a comprehensive view of all of their branches across the United States to understand performance metrics and identify areas of opportunity. Access to a central business intelligence platform allowed Schwab to bring all of their branch data into one view. Now branch managers can identify clients that may have a change in investment needs. And leadership can track if a region's performance is above or below average and click in to see the branches that are driving that region's performance. This leads to more opportunities for optimisation along with better customer service for clients.
Business intelligence tools and platforms
Many self-service business intelligence tools and platforms streamline the analysis process. This makes it easier for people to see and understand their data without the technical know-how to dig into the data themselves. There are many BI platforms available for ad-hoc reporting, data visualisation and creating customised dashboards for multiple levels of users. We have outlined our recommendations for evaluating modern BI platforms so you can choose the right one for your organisation. One of the more common ways to present business intelligence is through data visualisation.
Benefits of visual analytics and data visualisation

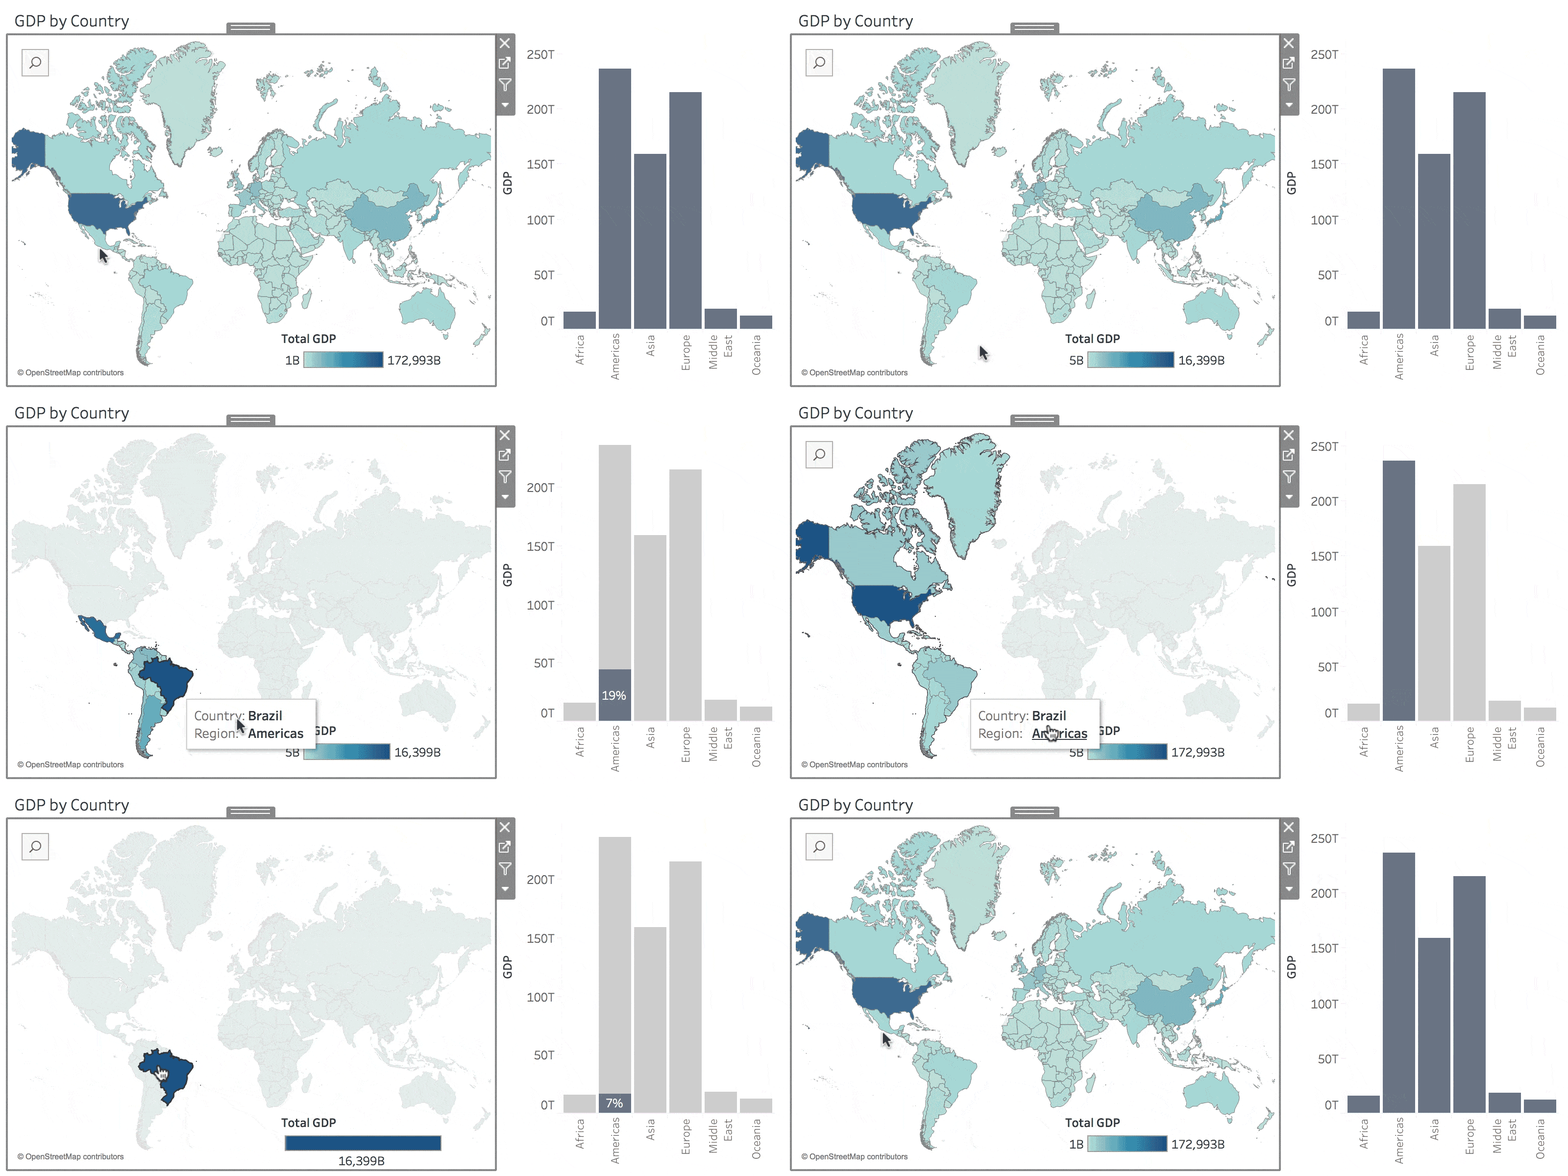
Visual analytics keeps you in the flow of data analysis.
One of the more common ways to present business intelligence is through data visualisation. Humans are visual creatures and very in tune with patterns or differences in colours. Data visualisations show data in a way that is more accessible and understandable. Visualisations compiled into dashboards can quickly tell a story and highlight trends or patterns that may not be discovered easily when manually analysing the raw data. This accessibility also enables more conversations around the data, leading to broader business impact.
Using self-service business intelligence (SSBI) for your company
Today, more organisations are moving to a modern business intelligence model, characterised by a self-service approach to data. IT manages the data (security, accuracy and access), allowing users to interact with their data directly. Modern analytics platforms like Tableau help organisations address every step in the cycle of analytics: data preparation in Tableau Prep, analysis and discovery in Tableau Desktop, and sharing and governance in Tableau Server or Tableau Cloud. This means that IT can govern data access while empowering more people to visually explore their data and share their insights.
The future role of business intelligence
Business intelligence is continually evolving according to business needs and technology, so each year, we identify current trends to keep users up to date on innovations. Understand that artificial intelligence and machine learning will continue to grow, and businesses can integrate the insights from AI into a broader BI strategy. As companies strive to be more data-driven, efforts to share data and collaborate will increase. Data visualisation will be even more essential to work together across teams and departments. This article is just an introduction to the world of business intelligence. BI offers capabilities for near-real-time sales tracking and allows users to discover insights into customer behaviour, forecast profits and more. Diverse industries like retail, insurance and oil have adopted BI, and more are joining each year. BI platforms adapt to new technology and their users’ innovations. Stay up to date with all of the trends and changes in business intelligence as we list the top 10 current trends in BI.