Start your analysis in the browser with Tableau 2018.1
Release days are always a thrill and we’re excited to announce the launch of Tableau 2018.1 and incredible new capabilities for data people including the ability to connect to data in the browser.
Scale your Tableau deployments faster and enable business users on your teams to complete their analysis with a full, end-to-end authoring experience directly in the browser.
We’re also excited to unveil Dashboard Starters for Tableau Online. Dashboard Starters are beautiful, data-rich dashboards populated with your data from common business applications like Salesforce in Tableau Online.
Plus, take advantage of more ways to connect to and visualize your data:
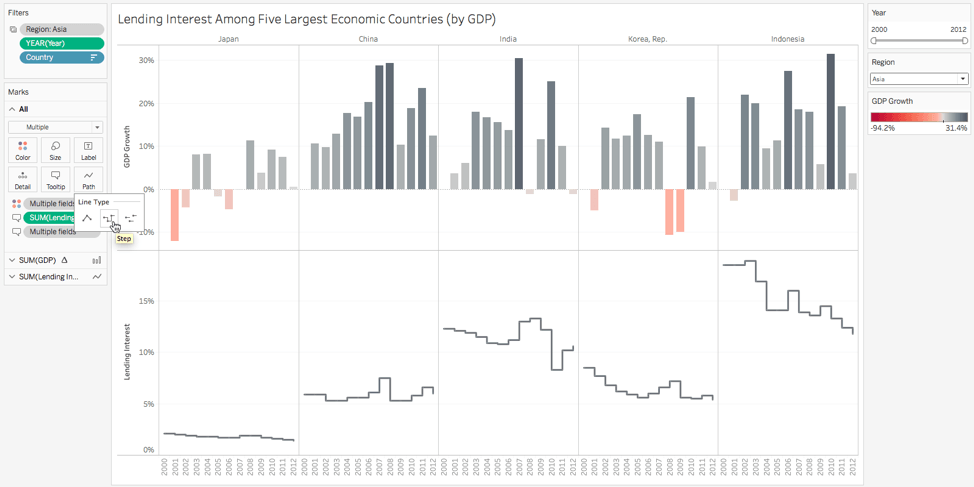
- Accurately show your discrete data with step and jump Lines.
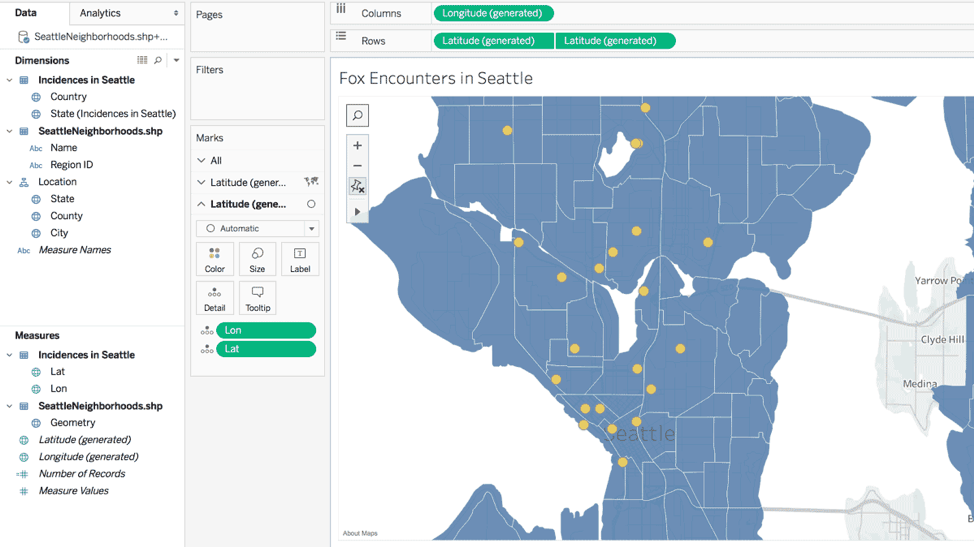
- Combine custom and generated latitudes and longitudes within a dual axis to build multi-layered maps.
- Connect to and visualize your spatial data in SQL Server.
- Use saved clusters in different sheets with new clustering functionality.
Connect to data directly from your browser
Tableau 2018.1 includes new web authoring capabilities that let you connect to 20+ data sources including SQL Server, Amazon Redshift, or local data sources like Excel from the browser. Enjoy a seamless flow with the ability to add joins, and create vizzes and dashboards.
With a web-based analytics experience, organizations can quickly add users and deploy Tableau to thin clients, like Chromebooks, while giving them the world-class Tableau authoring experience. And since web authoring is baked into Tableau Server and Tableau Online, your organizational data stays within Tableau’s secure and governed platform.
Dashboard Starters give you immediate insights
Your speed to answers just got faster. Use Dashboard Starters for your Eloqua, Marketo, Salesforce, and ServiceNow data to instantly answer your business questions. Dashboard Starters are pre-built dashboards that populate with your data when you connect in Tableau Online.
Since it's a full workbook, and not a locked-down template, business users can leverage Dashboard Starters to learn about a new data schema or as a starting point to customize their analysis.
More ways to visualize your data
You can now accurately show changes in your discrete data with step and jump lines. Use step lines to emphasize the magnitude of a change and jump lines for showing the duration of a change between points. Now it’s easy to accurately show changes over time for account balance data, inventory level data, interest rates, and much more.

New mapping capabilities let you build multi-layered maps by combining custom and generated latitudes and longitudes within a dual axis. Now you can build multilayered maps to visualize and analyze your spatial data with ease.

Even more data capabilities
Connect to your spatial data directly in SQL Server. Keep your live connection and use custom SQL to execute spatial operations in the database for advanced geospatial analysis.
Use clustering analysis in more places now that you can use saved clusters in different sheets. Clusters also update when data is refreshed, ensuring your cluster analysis always uses the latest data.
Other important things to know
With Tableau 2018.1, you'll be able to take advantage of our new subscription offerings and our new data prep product, Tableau Prep. The new subscription offerings changed our site roles and how they are provisioned when using our REST API or CSV upload feature. Check out our Tableau Server and Tableau Online upgrade guides to learn more.
Following Apple’s OS security update policy, we are ending support for MacOS 10.10. Security is extremely important to us, and by matching Apple’s security policy, we can provide a more secure Tableau experience. Tableau Desktop, Tableau Prep, Tableau Public and Tableau Reader 2018.1 are compatible with MacOS 10.11 and later. Future versions of Tableau will be compatible with the latest version of MacOS, plus the two proceeding versions. Our OS requirements for Windows and Linux remain unchanged.
You’re the best, Tableau Community!
With every release, we include features you’ve been asking for, and Tableau 2018.1 is no exception. From connect to data to jump lines, check out the Ideas forum in the community to see all of the features that have been incorporated based on your feedback. And be sure to continue adding ideas to inspire our development team—we couldn’t do it without you!
We’d like to extend a huge thank you to the 16,000 beta testers who tried the Tableau 2018.1 beta. Your time and energy has made this release one of our best yet. If you’d like to be involved in future beta programs, sign up today.
Related stories
Subscribe to our blog
Get the latest Tableau updates in your inbox.


