Spatial Parameters and Calculations: Make More Dynamic, Interactive Maps


Using maps in data visualization offers incredibly effective ways to both explore and communicate geospatial data for analysis. With the Tableau 2024.3 release, we’ve added new mapping superpowers with several features:
- Spatial Parameters
- Spatial Calculations (Symdifference, Intersection, Difference)
- Union Aggregation
We’ll take a closer look at each.
Spatial Parameters
Spatial parameters give you all the power of parameters for maps. Spatial Parameters allow users to select points, lines, or polygons to dynamically influence calculations—similar to existing parameter types, but with geospatial capabilities. You can also bring in spatial values outside of your data set, like using well-known text (WKT) to set values. With Spatial Parameters people can visually and dynamically explore spatial relationships on the fly in their Tableau workbooks.
The Tableau Community always amazes us with creative ways to use every type of parameter, and we’re just as excited to see how you’ll bring this new capability to life. Some of the powerful new ways you can explore your spatial data in Tableau using spatial parameters include:
- Explore spatial relationships between data sources that don’t support joins. Published Tableau data sources cannot be used in joins or creating relationships, but they can be used with spatial parameters in worksheet authoring.
- Skip some long joins. Previously, exploring spatial relationships between very large spatial datasets required a spatial join that could take hours to complete. Parameters are powerful and flexible because they can cross the boundaries between data sources, so you can now compare and contrast spatial regions across two data sources. Take it one step further and use a parameter action to compare regions across multiple data sources on the fly.
- Choose your own adventure with parameter controls. Like other parameter types, you can use a parameter control with spatial data. You can see aliases for list parameters with user-friendly names, or input a point, polygon, line, or anything else into your control. A viewer can take data from outside of your data sets and use them in your analysis.
- Enable truly dynamic, user-driven distance-based queries. If you can buffer it, you can find what’s inside! Control the size of the buffer using a parameter directly from the worksheet—no weaseling around with distance calcs and setting max sizes on an intersection join.
- Quickly filter or make sets based on spatial relationships. Since INTERSECTS() returns a true/false value, you can use that to quickly filter or create sets from your data and control results on other vizzes.
- Compare two regions on the fly. Using the new Spatial boolean calculations, you can quickly compare and contrast two regions and watch the viz change before your eyes.
- Empower users with streamlined joins for proximity-based questions. Spatial parameters allow users to pick their location (and distance) of interest to get tailored without you having to create all possible joins in advance.
- “Try it before you buy it.” Visually test out a spatial intersection on a small portion of your data to make sure you’ll be able to do the analyses you want before you scale up to join all of the data—it’s quick and easy!
- Interactively create your own regions. Spatial data is complex and useful. For spatial parameters, we allow not only points, lines, and polygons, but collections of points, lines and polygons. This means that you can create your own regions interactively using a parameter action. Imagine your sales area encompasses three states: Illinois, Indiana, and Ohio. You can select all three regions and create a spatial parameter with all of that data.
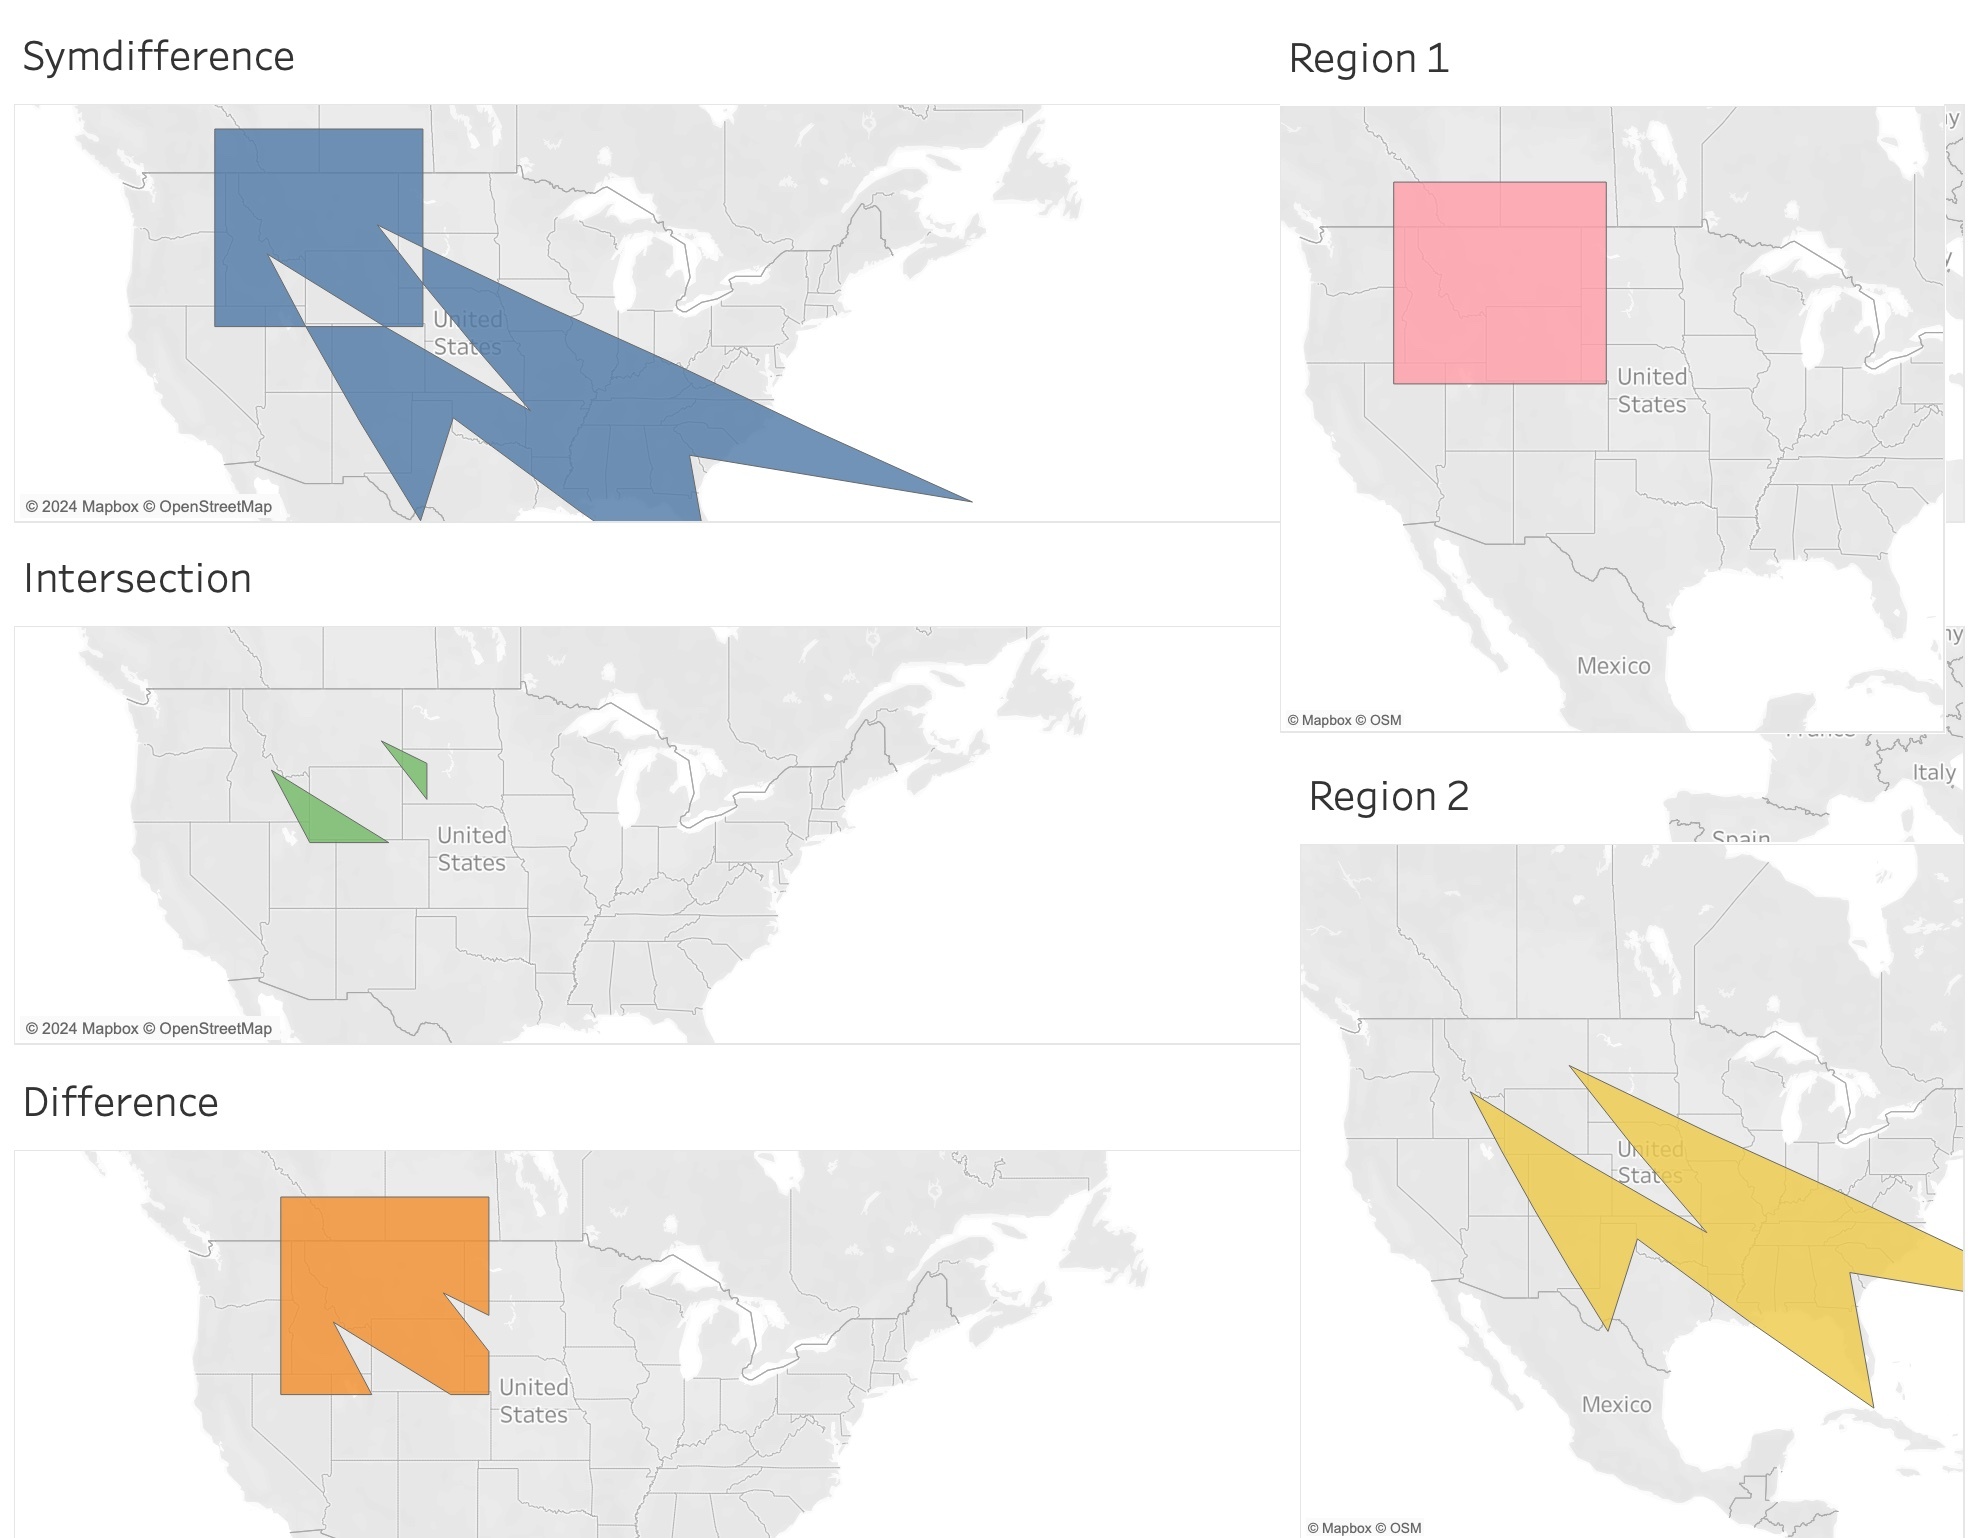
Spatial Calculations
Tableau 2024.3 also introduced three new spatial calculations that can be used to compare regions on maps. These Boolean spatial operators return a spatial object that you can view on a map to help you when evaluating spatial relationships:
- SYMDIFFERENCE will let you know which areas are unique between regions.
- INTERSECTION will let you know which area intersects.
- DIFFERENCE will let you know which area is included in one region, but not the other.
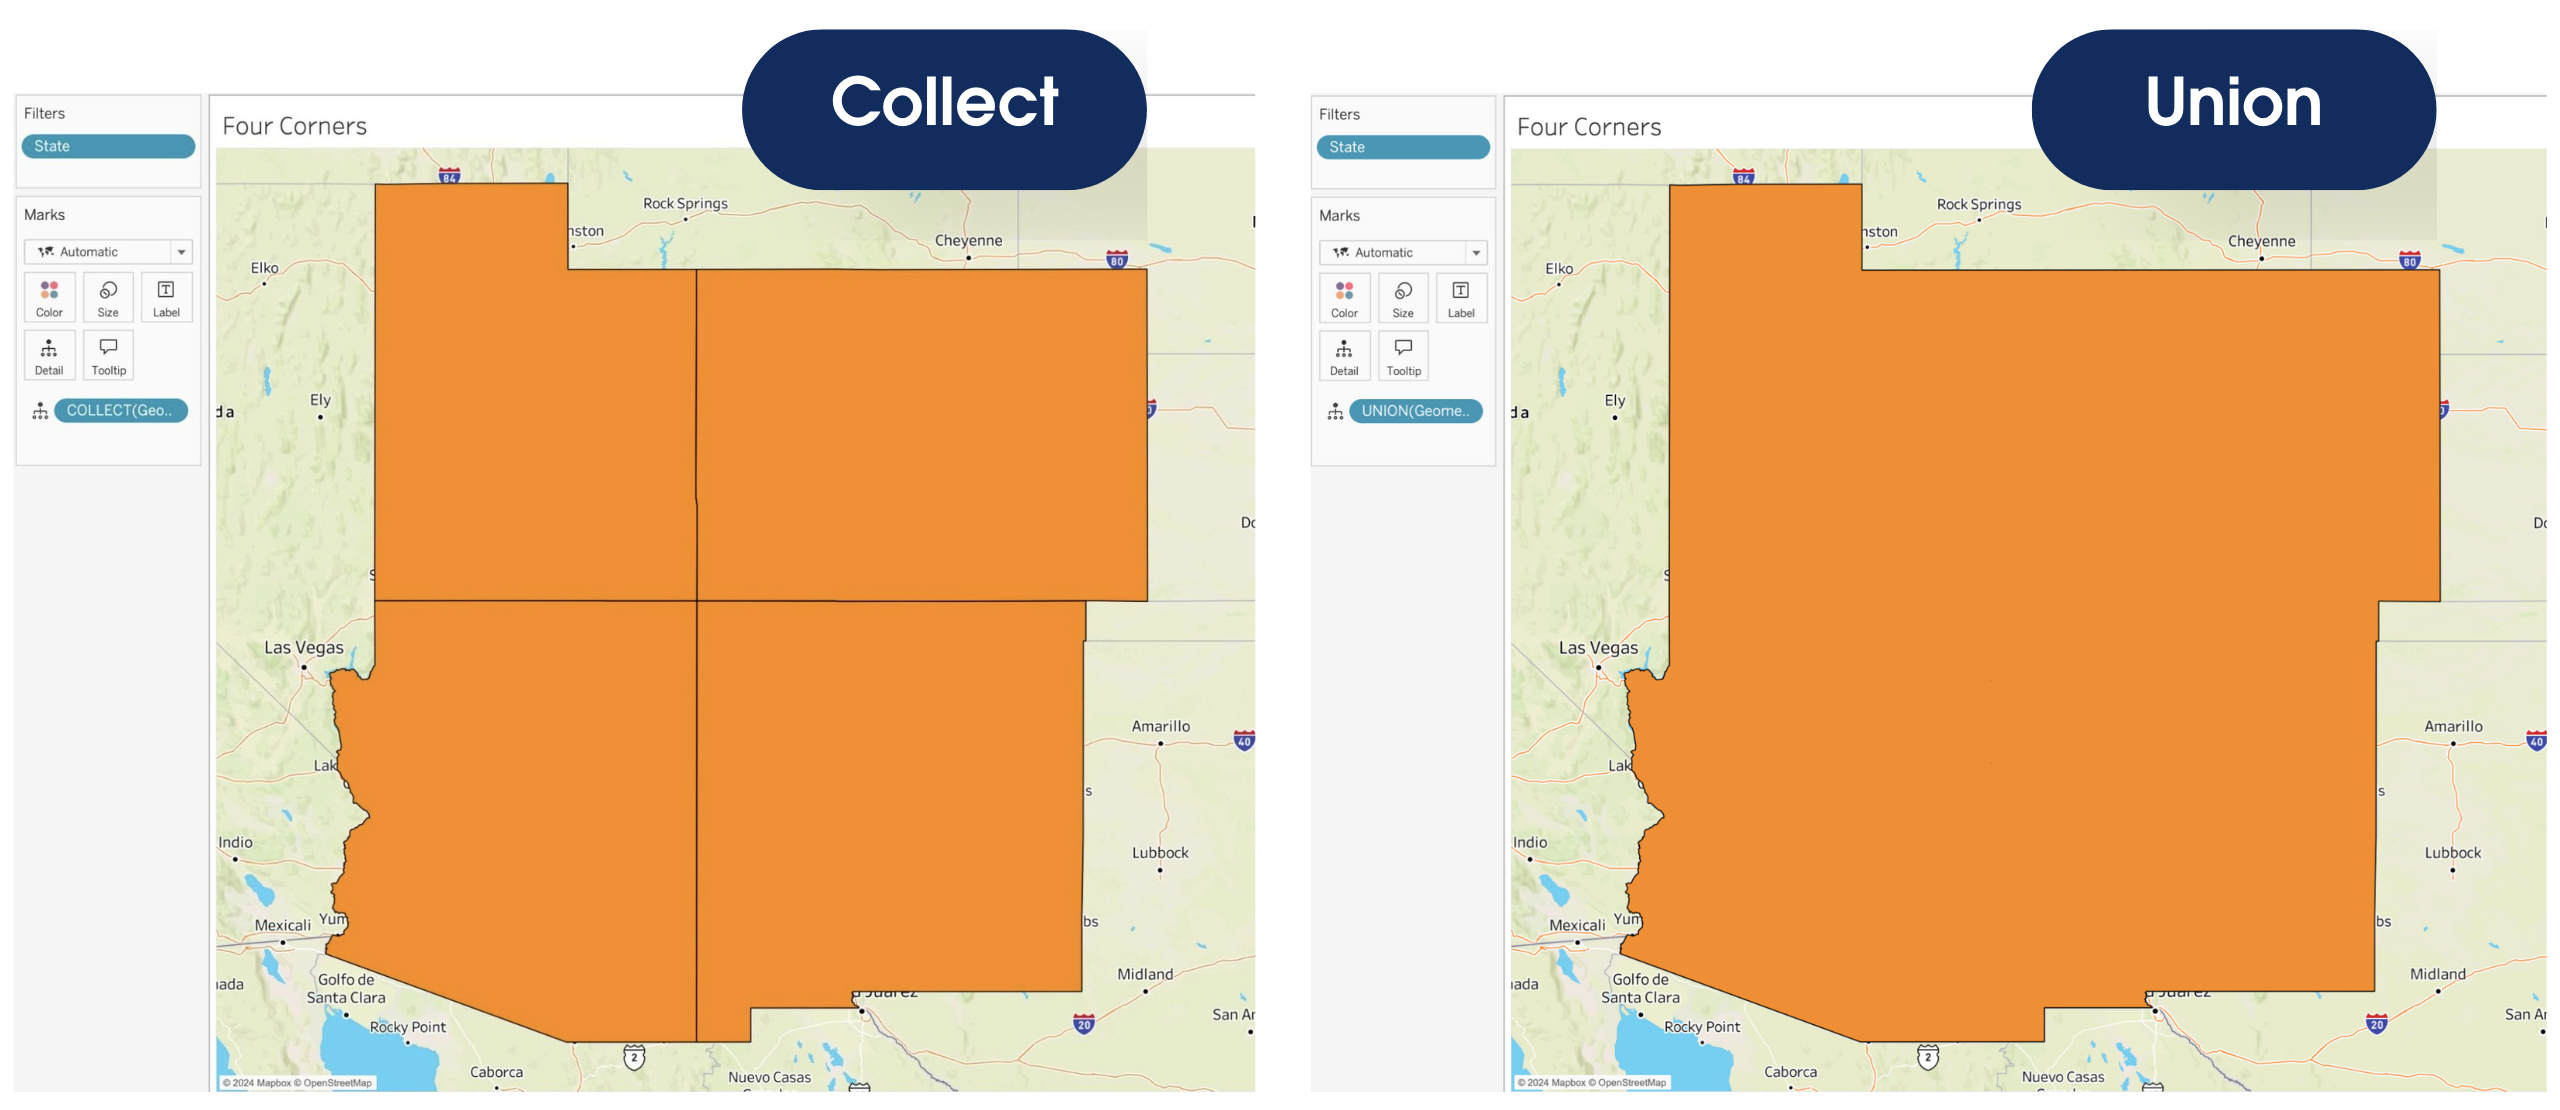
Union Aggregation
Previously, the only aggregation that was available for spatial values in Tableau was Collect. Now you can use Union. Union dissolves the boundaries between the included regions.
Validate Calculation
When you’re dealing with dirty spatial data, the Validate calculation may help you detect and correct the error. Although the Validate calculation was released with Tableau 2024.2, we wanted to mention it because it’s a helpful companion to these new geospatial capabilities.
Learn more and unlock the power of your maps
- Check out Tableau Help to dive deeper into these new spatial parameters and operators or to brush up on spatial functions in Tableau.
- Give these features a try with this sample Tableau workbook.
- You can also find some examples of vizzes using spatial features on Tableau Public.
Related stories

Product Innovation from Devs on Stage at Tableau Conference 2025
 16 April, 2025

What to Know About Tableau Next: FAQ
 7 April, 2025

Tableau 2025.1 Release Now Available: VizQL Data Service API, Tableau Cloud Release Preview Sites, and More
Subscribe to our blog
Get the latest Tableau updates in your inbox.