Now available in Tableau: Dynamic parameters, viz animations, buffer calculations and more
The newest release of Tableau is here! Tableau 2020.1 includes exciting ways to add powerful interactivity and storytelling to your data, bringing to life some of the most requested features from the Tableau Community. Upgrade to take advantage of these new innovations.
Let’s look at the highlights of this release:
- Ensure your dashboards always reflect the most recent and relevant data with dynamic parameters.
- Visually follow and understand how your data is changing to tell more powerful data stories with viz animations.
- Help your spatial analysis go the distance with buffer calculations to help you better understand proximity between marks.
- Better manage and scale your Tableau deployment with external file store, login-based licence management and the ability to set permissions on nested projects.
Set it and forget it: dynamic parameters are here
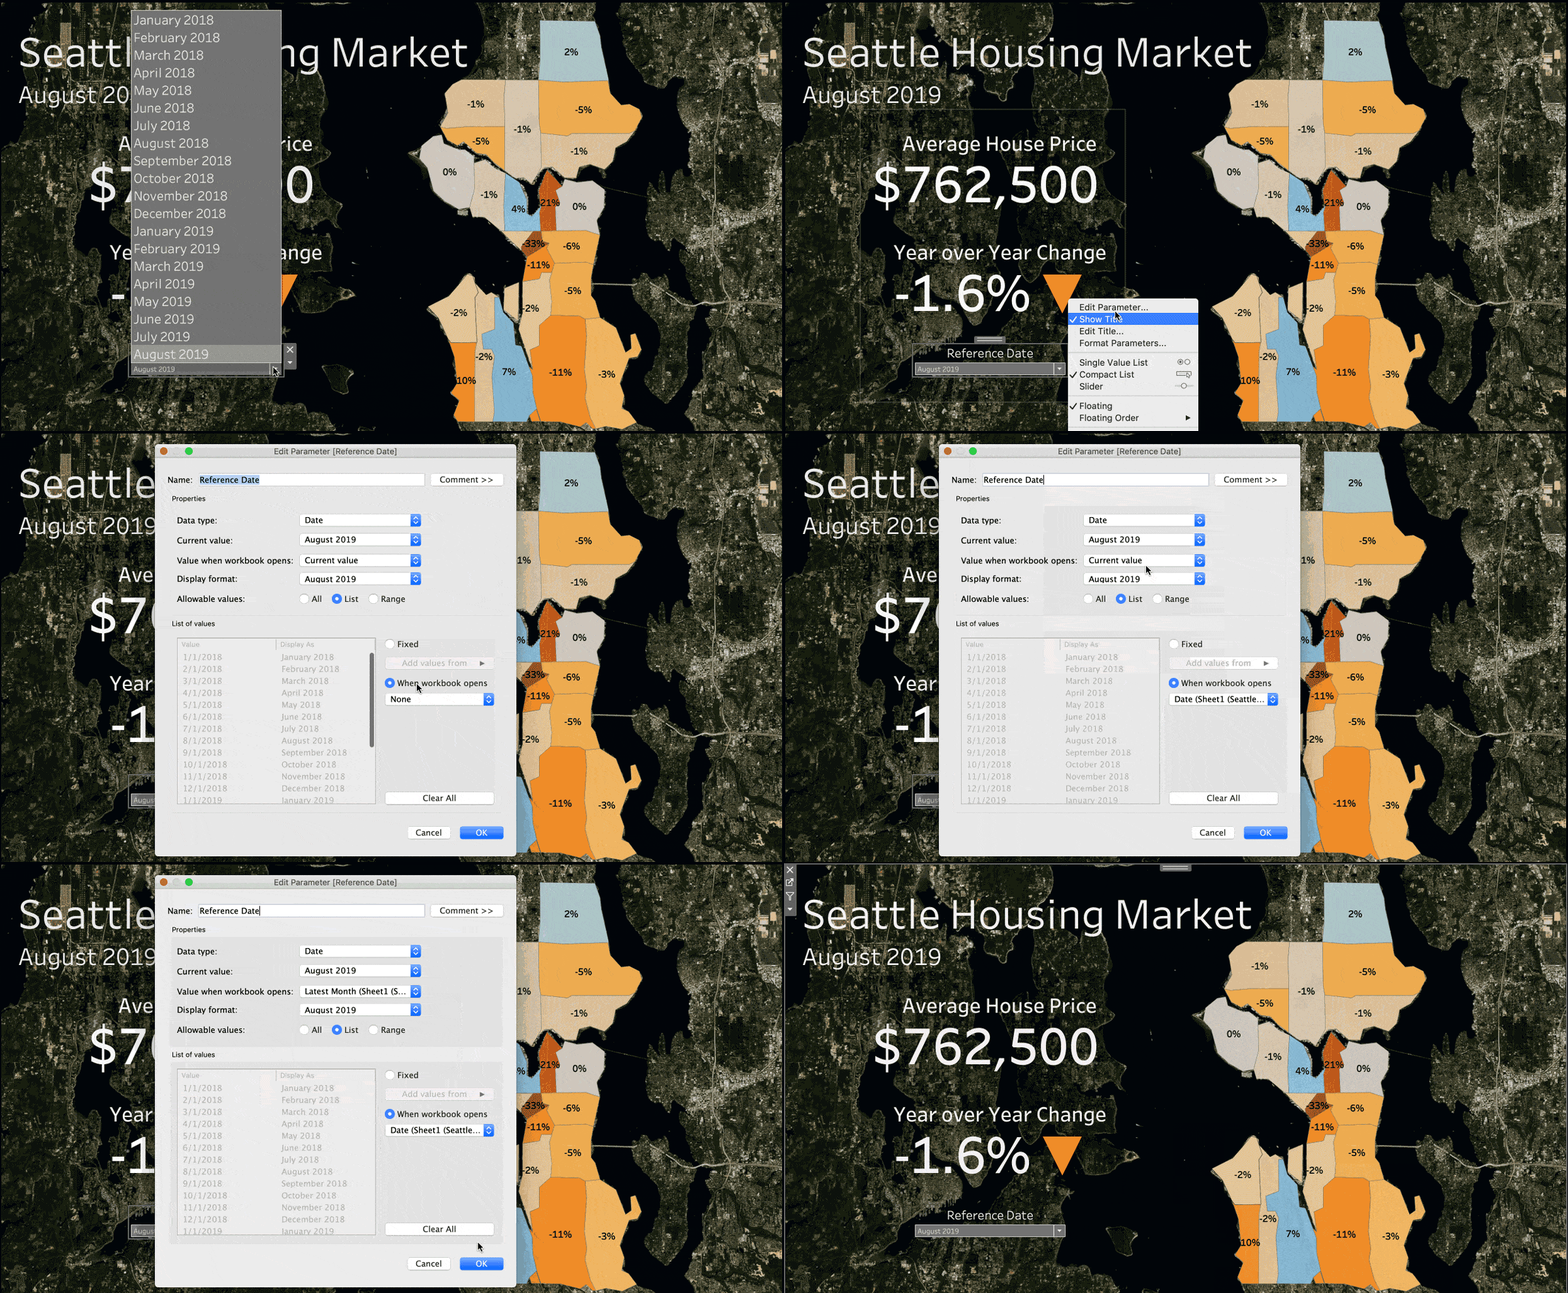
We’ve never been happier to announce a feature. In Tableau 2020.1, we’ve made the most requested feature on the Tableau Ideas Forum a reality. That’s right: dynamic parameters are here. You no longer have to republish workbooks that contain parameters every time the underlying data changes. This removes the need for tedious workbook maintenance, saving you exponential time and energy. Dynamic parameters also minimise complex workarounds, which makes interacting with workbooks a straightforward and delightful experience for you – and your stakeholders as well.
To do this, open the parameter dialogue and note the new When workbook opens option. Change the drop-down’s selection to the relevant field and that’s it! Tableau will now update the parameter’s list of values according to the column you selected. The example below shows housing data for the city of Seattle, using a Reference Date parameter that can now be configured to update automatically every time someone opens the workbook, always making the most current data available.

In addition to dynamic parameters, Tableau 2020.1 brings another feature designed to help your dashboards meet the diverse needs of your organisation and the people in it, regardless of their skill level. A new dashboard button allows people to quickly export a dashboard in the format of their choice by simply by clicking a button and exporting to image, PDF or PowerPoint.
Data that moves – and moves you – with Tableau viz animations
Empower your users to tell more compelling and relevant data stories with viz animations. This feature applies animated transitions to marks on a visualisation to help you see and understand your changing data. Sorting, filtering, adding fields and other actions will now smoothly animate your vizzes.
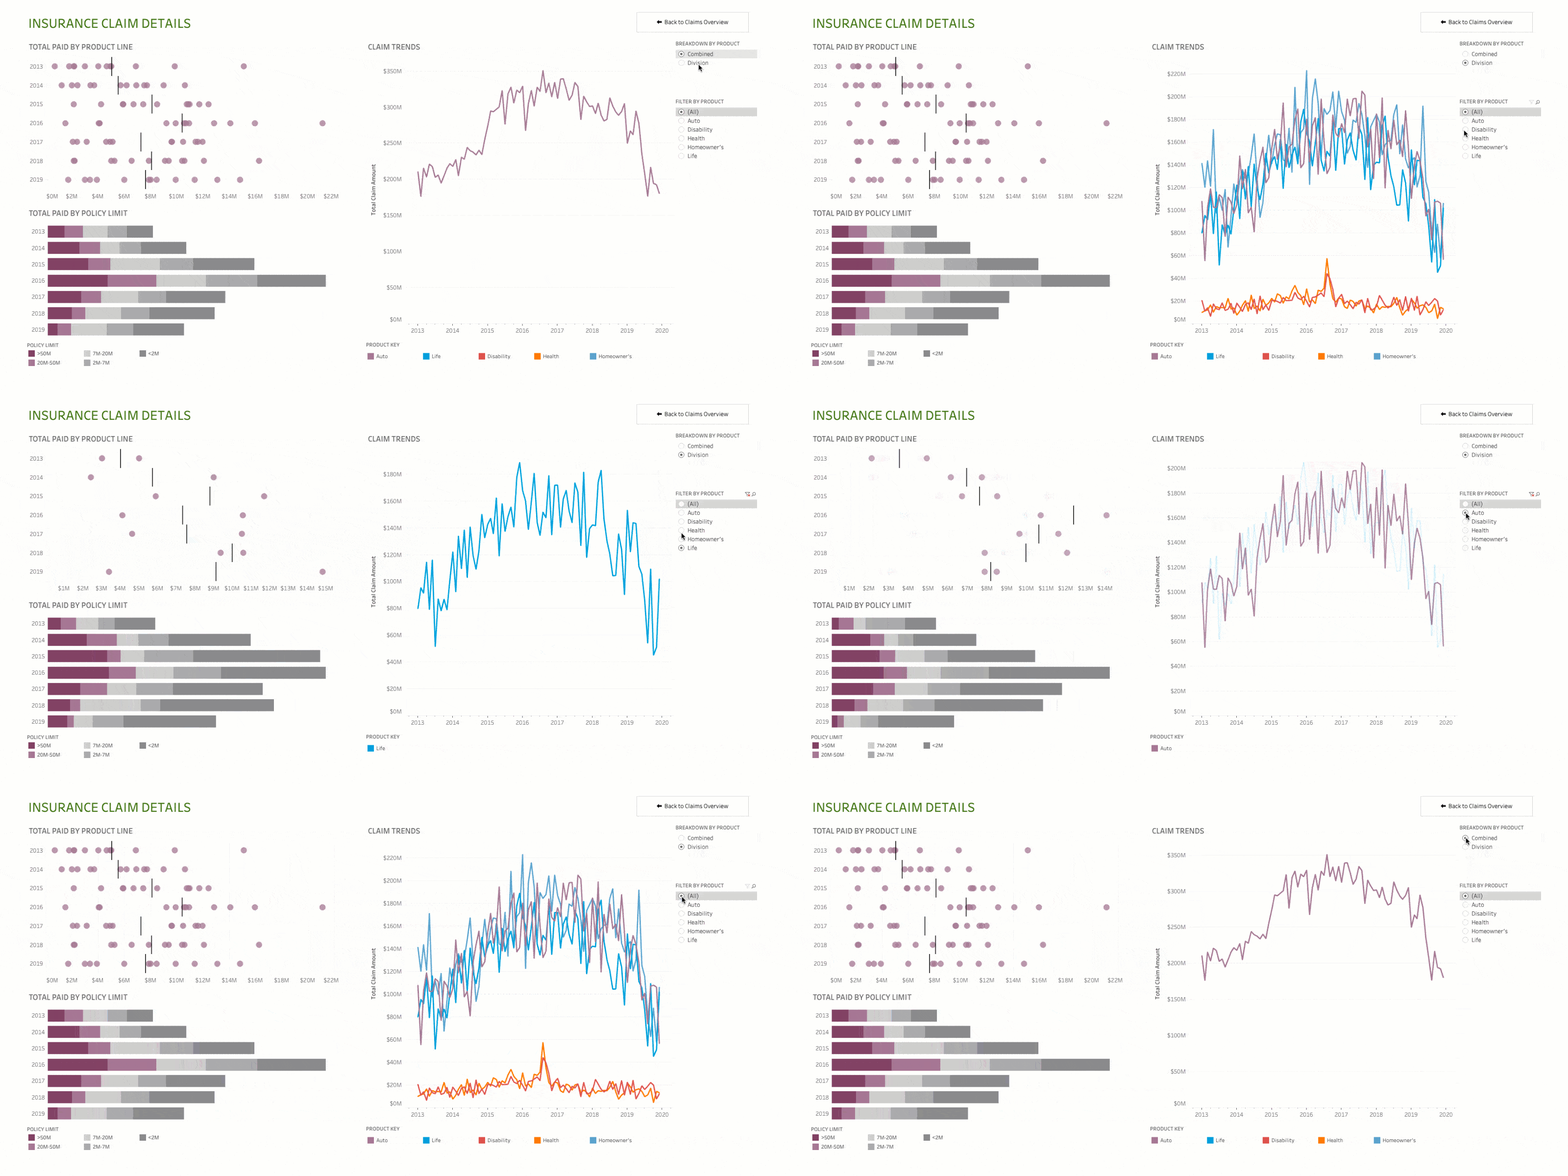
Animations are a powerful tool for revealing and explaining the analytical steps that result in a visualisation. In the example below, notice the Breakdown by product filter. As you click from Combined to Division, you can see that the single line showing total claims is actually an aggregated amount that smoothly breaks out into three different divisions. As you filter by product, it’s easy to follow how marks on the other views shift, visually reinforcing the changes in your data. Without movement, these changes would be much harder to see and understand, obscuring potential insights or lengthening the time it takes a person to process the information in your dashboard.

Enabling animations is as simple as selecting On in the Animations format pane, with no setup required. If you don’t need animation, you can choose to turn the feature off at the worksheet, workbook, or user level. Animations are turned off by default, giving you the control to decide if animations are needed for a visualisation. We encourage authors to think through their use case, determining if using animations creates the best experience for end users. More information about using viz animations can be found in this article.
Spatial analysis goes the distance with buffer calculations
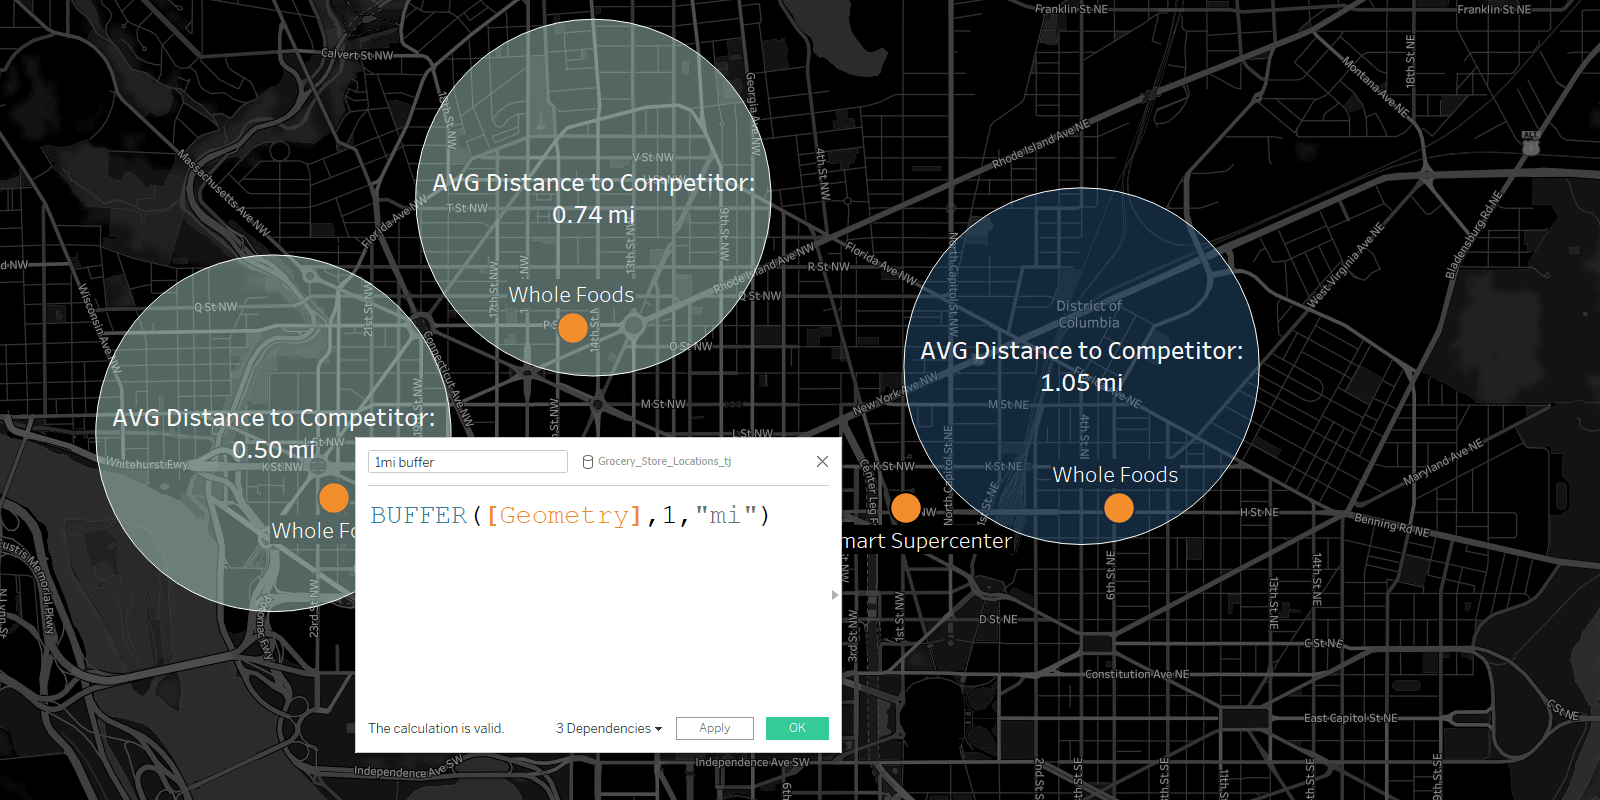
Understanding proximity and distance in Tableau is easier than ever in 2020.1. We’re introducing buffer calculations, a powerful addition to the Tableau geo-spatial toolkit. With buffer calculations, complex spatial analysis becomes more accessible. Give Tableau three parameters – location, distance, and a unit of measure – and it instantly creates a buffer or boundary. With buffer calcs, it’s easy to answer questions like, “How many competitors are in a two-mile radius of my retail store locations?” or determine the number of housing units within one kilometre of a railway station, for example.

Manage a more scalable Tableau deployment
We know managing licence keys for thousands for Creators can be cumbersome. That’s why we’re excited to introduce login-based licence management. Login-based licence management allows Creators to activate Tableau Desktop or Tableau Prep by simply logging in to these products with their Tableau Server credentials – no product key needed. Admins can assign, monitor and reclaim Tableau Desktop or Tableau Prep access directly from Tableau Server instead of distributing licence keys to end users. Tableau Online customers can take advantage of this new licensing compatibility today. For Tableau Server customers, this licensing option is available to role-based deployments, so contact your account team to learn more.
We’re also making Tableau Server more flexible. As part of the Server Management Add-on, you can now use network storage devices to hold backup snapshots, which significantly reduces the time required to perform a backup. You can also use this new capability to streamline your deployment topology by centralising your file store, eliminating the need to run file stores on multiple nodes in a Tableau Server cluster.
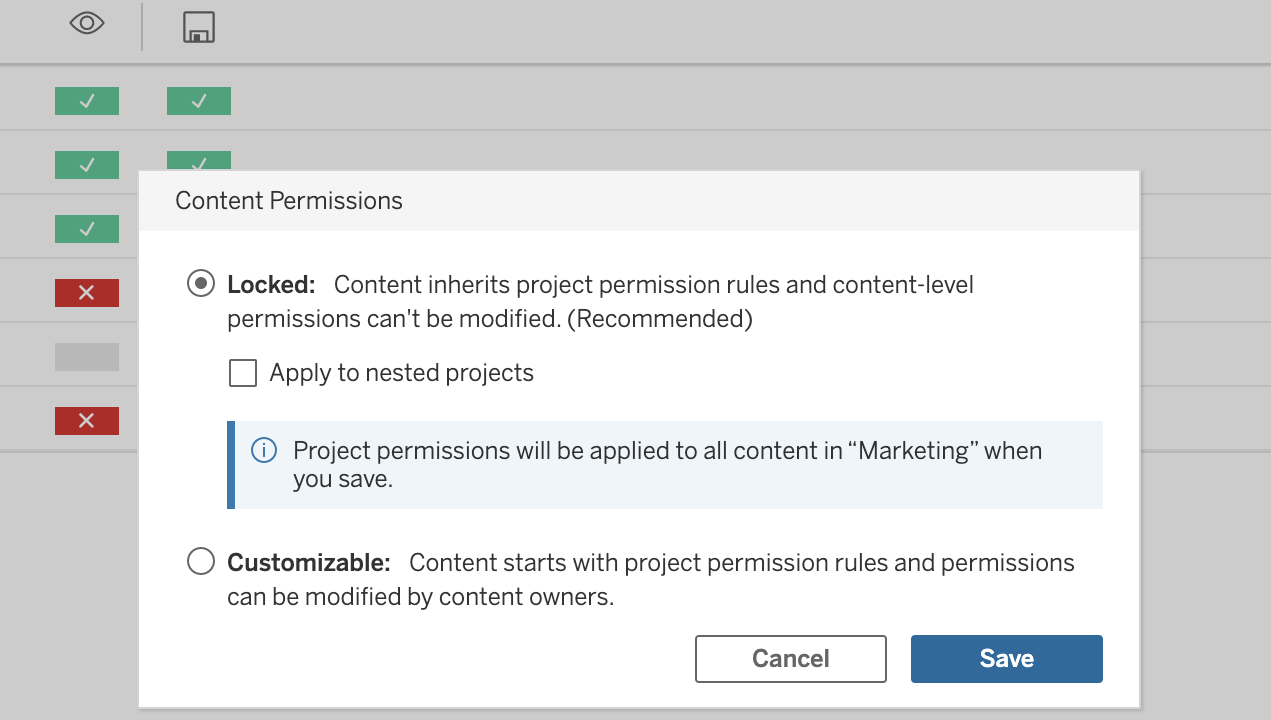
And lastly, we are delivering a highly requested server admin feature: the ability to set permissions for nested projects. In Tableau 2020.1, you can now control the permission settings separately for content in a project and any nested projects it contains. Improve navigation and organisation of your site’s content and allow site admins to delegate more effectively to non-admins.

These are just a few highlights from 2020.1. Check out tableau.com/en-gb/new-features to learn more.
Thank you, Tableau Community!
You are at the heart of everything we do and the Tableau 2020.1 release is no different. We can’t do this without you, so thank you for your continued feedback and inspiration. Check out the Ideas forum to see all of the features that have been incorporated as a result of your brilliant ideas.
We’d also like to extend our thanks to the many testers who tried out Tableau 2020.1 in beta. We appreciate your time and energy to help make this release successful.
Get the newest version of Tableau today, and if you’d like to be involved in future beta programmes, please sign up to participate.
Related stories
Subscribe to our blog
Get the latest Tableau updates in your inbox.


