DataFam Roundup: March 24-28, 2025
Welcome! Dig into this week's DataFam Roundup—a weekly blog that brings together community content all in one post. As always, we invite you to send us your content—and the DataFam content from your peers that have inspired you! Find the content submission form here.
Community Highlight
To recognize new and consistent Tableau contributors—we’re excited to have a section within the weekly DataFam Roundup called the Tableau Community Highlight. Find out how to get involved.

Rida Hamid, BI Specialist
Pakistan
Rida Hamid is a BI Specialist. She first discovered Tableau through social media, where she noticed a big community of professionals talking about the tool and sharing their work. Her interest was sparked and she began exploring Tableau Public, which led her to utilizing YouTube tutorials, Udemy courses, and Tableau’s learning resources to gain a deeper understanding of Tableau herself.
Now, Rida is highly involved in the Tableau Community, participating in seven Tableau User Groups. She is also active on the Tableau Forums, finding answers to questions and providing answers to others. Rida especially enjoys working with the Tableau Newbies community to help those getting started on their Tableau journey, she shares her knowledge on LinkedIn to help beginners navigate Tableau more efficiently and make learning easier for others.
Connect with Rida on LinkedIn, X, and Tableau Public.
DataFam Content
Dive into content created by the Tableau Community:
- Adam Mico (Lindsay Betzendahl, on logo): The 2025 #DataFamRisingStars are Here!
- Sarah Bartlett: Essential Tips for Attending Tableau Conference 2025
- Bridget Cogley: Maybe you SHOULD judge this book by its cover…
- Brittany Rosenau: Recreating Fitbit Style Rounded Bars with Goal Icons in Tableau
- Oliver Linley: How to Build Donut Charts in Tableau
- Chris Perry: Tableau Server Client: Content Mirror
- Data2Vizuals: Tableau: US Hex Maps: The Why and How
- Steve Adams: Are you structuring your dashboards properly?
- Deepak Holla:
Team Tableau Content
- Sign up to stream the Tableau Conference 2025 - Main Keynote live!
- LinkedIn or Salesforce+ on April 15 at 10 a.m. PT.
- Tableau 2025.1 is now available!
- The Agenda Builder for Tableau Conference #TC25 is live!
- Personalize your conference experience by adding sessions to your schedule. New to TC this year, attendees can reserve seats in session types including breakouts, hands-on trainings, and roundtables.
Visualizations

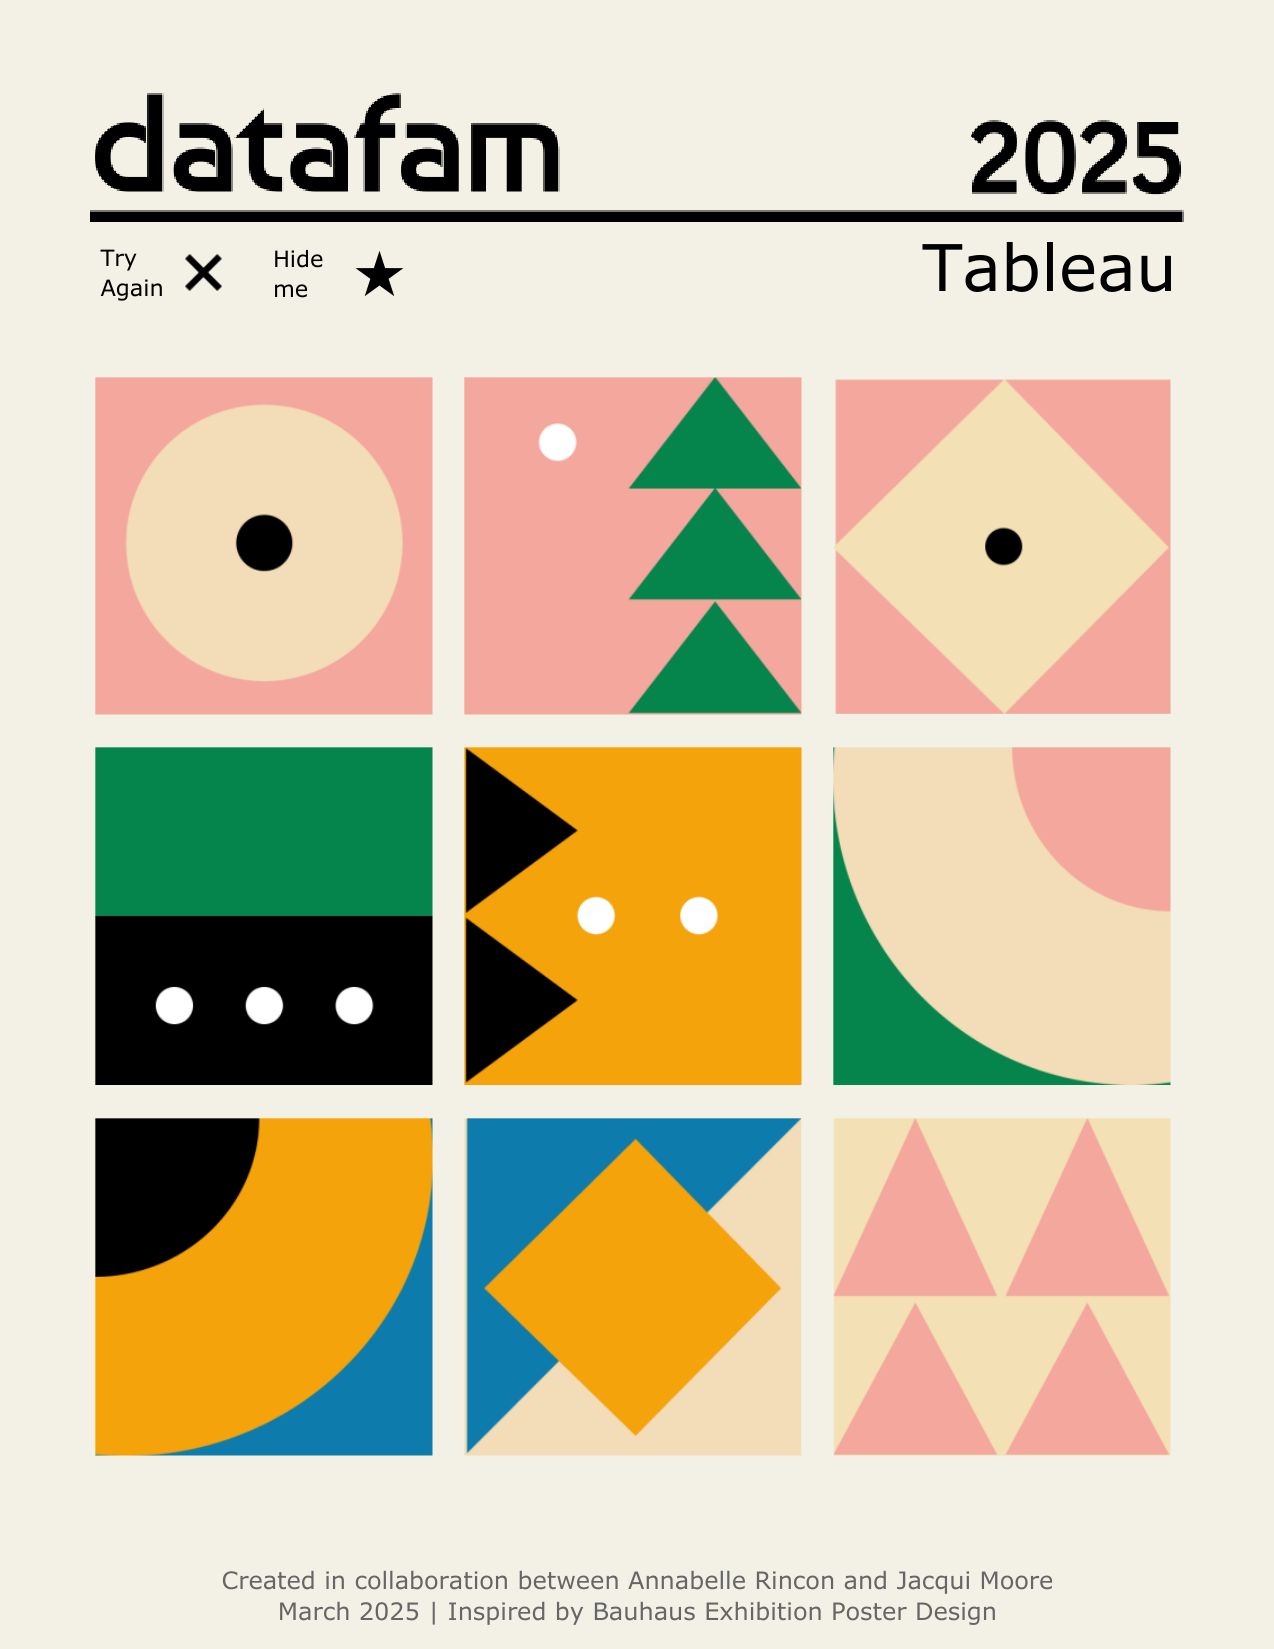
Jacqui Moore & Annabelle Rincon: Bauhaus Poster - collaboration with Annabelle Rincon ♥
See the latest Viz of the Day, trending vizzes, featured authors, and more on Tableau Public.
Check out some inspirational vizzes created by the community:
- SantasQ: Godzilla Loves Tokyo(IMDb)
- Lara Willson: B2VB - 2025 Week 5 - Scatter Plot
- Sadia Ahmed: GCC Remittance 2016
- Louis Yu: One in a Minion
- Waqar Ahmed Shaikh: RACE TO THE TOP - Profit & Ranking of Pakistan's Top Banks
- Jacob Rothemund: Formula 1 2025 Qualifying Starting Grids Using Map Layers
- Ajay Vishnu Addala: Productivity Benchmarks | #MOM2025 W13 | #B2VB2025 W6
- Deepak Holla: 3 Possible Ways to Visualize Flow in Tableau
- Ojoswi Basu: #MakeoverMonday 2025 WK12 Global Precipitation
- Shangruff Raina:
Community Projects
Back 2 Viz Basics
A bi-weekly project helping those who are newer in the community and just starting out with Tableau. Not limited just to newbies!
Web: Back 2 Viz Basics
X: #B2VB
Workout Wednesday
Build your skills with a weekly challenge to re-create an interactive data visualization.
Web: Workout Wednesday
X: #WOW2022
Preppin' Data
A weekly challenge to help you learn to prepare data and use Tableau Prep.
Web: Preppin’ Data
X: #PreppinData
Makeover Monday
Create business dashboards using provided data sets for various industries and departments.
Web: Makeover Monday
X: #MakeoverMonday
Visual Climate
Collaborate and share climate data.
Web: Visual Climate
X: #VisualClimate
DataFam Con
A monthly challenge covering pop culture and fandoms.
Web: DataFam Con
X: #DataFamCon
EduVizzers
A monthly project connecting real education data with real people.
Web: Eduvizzers
Viz for Social Good
Volunteer to design data visualizations that help nonprofits harness the power of data for social change.
Web: Viz for Social Good
X: #VizforSocialGood
Games Night Viz
A monthly project focusing on using data from your favorite games.
Web: Games Nights Viz
X: #GamesNightViz
Iron Quest
Practice data sourcing, preparation, and visualization skills in a themed monthly challenge.
Web: Iron Quest
X: #IronQuest
Storytelling with Data
Practice data visualization and storytelling skills by participating in monthly challenges and exercises.
Web: Storytelling with Data
X: #SWDChallenge
Project Health Viz
Uncover new stories by visualizing healthcare data sets provided each month.
Web: Project Health Viz
X: #ProjectHealthViz
Diversity in Data
An initiative centered around diversity, equity & awareness by visualizing provided datasets each month.
Web: Diversity in Data
X: #DiversityinData
Sports Viz Sunday
Create and share data visualizations using rich, sports-themed data sets in a monthly challenge.
Web: Sports Viz Sunday
X: #SportsVizSunday
Real World Fake Data
Create business dashboards using provided data sets for various industries and departments.
Web: Real World Fake Data
X: #RWFD
Data Plus Music
A monthly project visualizing the data behind the music we love!
Web: Data Plus Music
X: #DataPlusMusic
Related stories
Subscribe to our blog
Get the latest Tableau updates in your inbox.


