DataFam Roundup: April 7-11, 2025


Welcome! Dig into this week's DataFam Roundup—a weekly blog that brings together community content all in one post. As always, we invite you to send us your content—and the DataFam content from your peers that have inspired you! Find the content submission form here.
Community Highlight
To recognize new and consistent Tableau contributors—we’re excited to have a section within the weekly DataFam Roundup called the Tableau Community Highlight. Find out how to get involved.

Richa Rambhia, Insights Analyst at Blue Cross NC
Texas, USA
Richa Rambhia is an Insights Analyst at Blue Cross NC. She utilizes Tableau to transform complex datasets into interactive visualizations that facilitate informed decision-making for stakeholders. She also shares her analyses on various topics with the broader community by publishing visualizations on Tableau Public. Her Tableau journey began during her undergraduate studies in Computer Science Engineering, where she was captivated by its ability to create compelling visual narratives from data. She honed her skills through online tutorials, formal coursework, hands-on projects, and obtaining a Tableau Desktop Certification.
Richa actively engages with the Tableau Community, cherishing its collaborative spirit and knowledge-sharing. She finds inspiration for her visualizations from real-world datasets, ongoing trends, and Tableau challenges, as well as from the work of other Tableau Public authors. Her website serves as a platform to document and share her data journey, projects, and insights, while also connecting with like-minded individuals. She further contributes to the community by publishing vizzes, engaging in forum discussions, sharing insights on blogs, participating in local User Group meetings, and connecting through LinkedIn. Richa also shares her knowledge through open-source projects and mentorship programs, fostering collaborative learning and giving back to the supportive community.
Connect with Richa on Linkedin, Tableau Public, and on her blog.
DataFam Content
Dive into content created by the Tableau Community:
- Brittany Rosenau: The TC25 Step Tracker is Live! Time to Track and Submit your Steps!
- Martha Emily Kund & Matt Francis: The Vizzies Top 10ish Nominees
- Serena Purslow: Custom Format Labels
- Le Luu: VizQL Data Service
- Johan de Groot: API to Tableau, the Smart Way: A Guide to Table Extensions
- Steve Adams: Table Calculations & The Final Flourish
- Deepak Holla:
Team Tableau Content
- Download the Tableau Conference 2025 mobile app!
- Don’t forget to pack your headphones and come with a fully charged mobile device. Some Theater and Breakout sessions will require Live Session Audio.
- Sign up to stream the Tableau Conference 2025 - Main Keynote live!
- LinkedIn or Salesforce+ on April 15 at 10 a.m. PT.
- The Agenda Builder for Tableau Conference #TC25 is live!
- Personalize your conference experience by adding sessions to your schedule. New to TC this year, attendees can reserve seats in session types including breakouts, hands-on trainings, and roundtables.
Visualizations
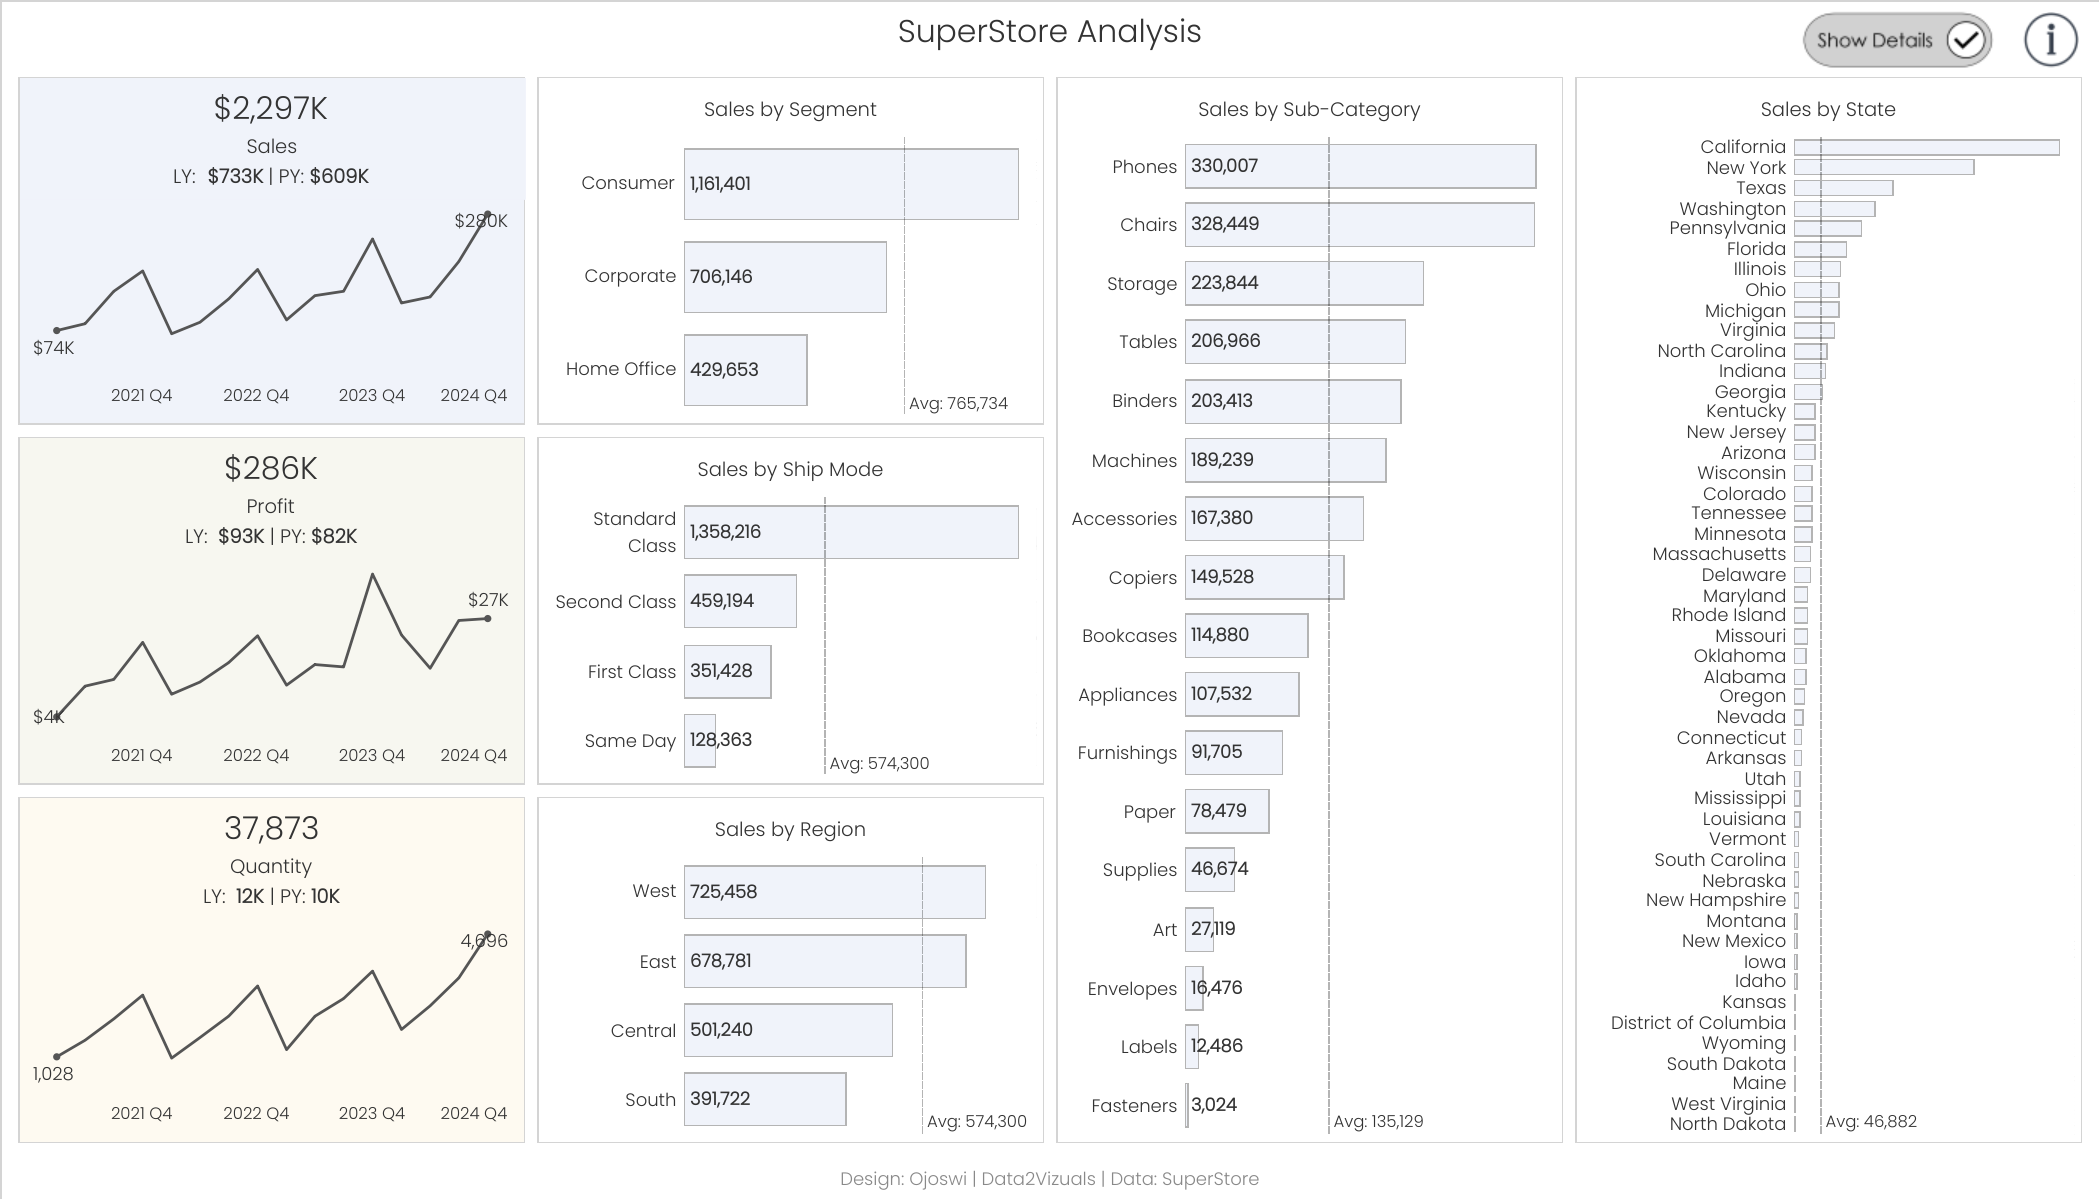
Ojoswi Basu: SuperStore Analysis
See the latest Viz of the Day, trending vizzes, featured authors, and more on Tableau Public.
Check out some inspirational vizzes created by the community:
- Veronica Simoes: Diabetes Prevention and Care
- Deepak Holla: 8 Possible Ways to Visualize Multiple Measures in Tableau
- Shangruff Raina: THE DOOMSDAY CLOCK || #MakeoverMonday 2025 Week 15
Community Projects
Back 2 Viz Basics
A bi-weekly project helping those who are newer in the community and just starting out with Tableau. Not limited just to newbies!
Web: Back 2 Viz Basics
X: #B2VB
Workout Wednesday
Build your skills with a weekly challenge to re-create an interactive data visualization.
Web: Workout Wednesday
X: #WOW2022
Preppin' Data
A weekly challenge to help you learn to prepare data and use Tableau Prep.
Web: Preppin’ Data
X: #PreppinData
Makeover Monday
Create business dashboards using provided data sets for various industries and departments.
Web: Makeover Monday
X: #MakeoverMonday
Visual Climate
Collaborate and share climate data.
Web: Visual Climate
X: #VisualClimate
DataFam Con
A monthly challenge covering pop culture and fandoms.
Web: DataFam Con
X: #DataFamCon
EduVizzers
A monthly project connecting real education data with real people.
Web: Eduvizzers
Viz for Social Good
Volunteer to design data visualizations that help nonprofits harness the power of data for social change.
Web: Viz for Social Good
X: #VizforSocialGood
Games Night Viz
A monthly project focusing on using data from your favorite games.
Web: Games Nights Viz
X: #GamesNightViz
Iron Quest
Practice data sourcing, preparation, and visualization skills in a themed monthly challenge.
Web: Iron Quest
X: #IronQuest
Storytelling with Data
Practice data visualization and storytelling skills by participating in monthly challenges and exercises.
Web: Storytelling with Data
X: #SWDChallenge
Project Health Viz
Uncover new stories by visualizing healthcare data sets provided each month.
Web: Project Health Viz
X: #ProjectHealthViz
Diversity in Data
An initiative centered around diversity, equity & awareness by visualizing provided datasets each month.
Web: Diversity in Data
X: #DiversityinData
Sports Viz Sunday
Create and share data visualizations using rich, sports-themed data sets in a monthly challenge.
Web: Sports Viz Sunday
X: #SportsVizSunday
Real World Fake Data
Create business dashboards using provided data sets for various industries and departments.
Web: Real World Fake Data
X: #RWFD
Data Plus Music
A monthly project visualizing the data behind the music we love!
Web: Data Plus Music
X: #DataPlusMusic
Related stories

Meet 2025 Iron Viz Finalist Bo McCready
 8 April, 2025

Meet 2025 Iron Viz Finalist Kathryn McCrindle
6 April, 2025

DataFam Roundup: March 31-April 4, 2025
Subscribe to our blog
Get the latest Tableau updates in your inbox.