What is Descriptive Analytics?
Whether you’re filling out a customer satisfaction survey, returning a purchase, or sharing a social media post, many of our interactions become data. Organizations analyze this data to make informed decisions and better understand the past. This process is called descriptive analytics.
Descriptive analytics is a type of data analytics that uses raw, historical data to identify patterns, trends, and relationships. This process helps decision-makers understand what occurred in the past using historical data. Then, they can use the data findings to find opportunities and challenges looking forward. It can also be used to assess how current initiatives are progressing.
Using data analytics to make decisions helps track progress, identify benchmarks, and justify goals. Descriptive analytics can be used to help organizations better understand customer behavior, which in turn helps them make data-driven decisions, like adjusting strategies or personalizing communications.
Benefits of descriptive analytics
By analyzing raw, aggregate data, descriptive analytics can be used to create reports. These reports can be used to compare current metrics to historical data.
Identifying trends in customer behavior and preference is a major benefit of descriptive analytics. For example, a restaurant could use descriptive analytics to analyze data surrounding what time customers came to eat or which dishes were the most popular. These insights could be used to change the menu or staff employees at certain times of the day.
Tracking goals is made easier with the use of descriptive analytics through succinct reporting and automated dashboards. For example, if a project lasts for a year, data could be analyzed quarterly or monthly. Using descriptive analytics is a good way to ensure the timeline, budget, or engagement is on track. It’s also helpful to iterate on plans and make adjustments.
Business use cases
A few common business use cases of descriptive analytics include:
- Performance analysis
- Demand forecasting
- Social media and website analytics
- Operational efficiency analysis
- Financial analysis
Challenges of descriptive analytics
A lack of data is the main challenge when it comes to descriptive analytics. In order to find trends and insights, there must be a substantial amount of historical data to use. Organizations who haven’t collected data or haven’t collected enough data over a long enough period of time will have trouble conducting descriptive analytics.
Challenges at work
Data organization can be a challenge. If teams have tracked data in different ways or file types over the years, the resulting information can be messy and hard to combine. Different teams may have collected different types of data, offering incomplete information. For example, one group may have only collected customer’s email addresses while the other only collected phone numbers. Marrying data housed in older formats like spreadsheets with newer software may be time-consuming. Data cleaning and preparation is one way to remedy this.
If you’re interested in conducting data analytics of any kind, ask questions like:
- Who will do the analysis and what software will you use?
- Who is going to conduct the descriptive analysis?
- Will you increase headcount or work with a consulting agency?
- Where is the budget coming from for the resources and software?
The descriptive analytics process

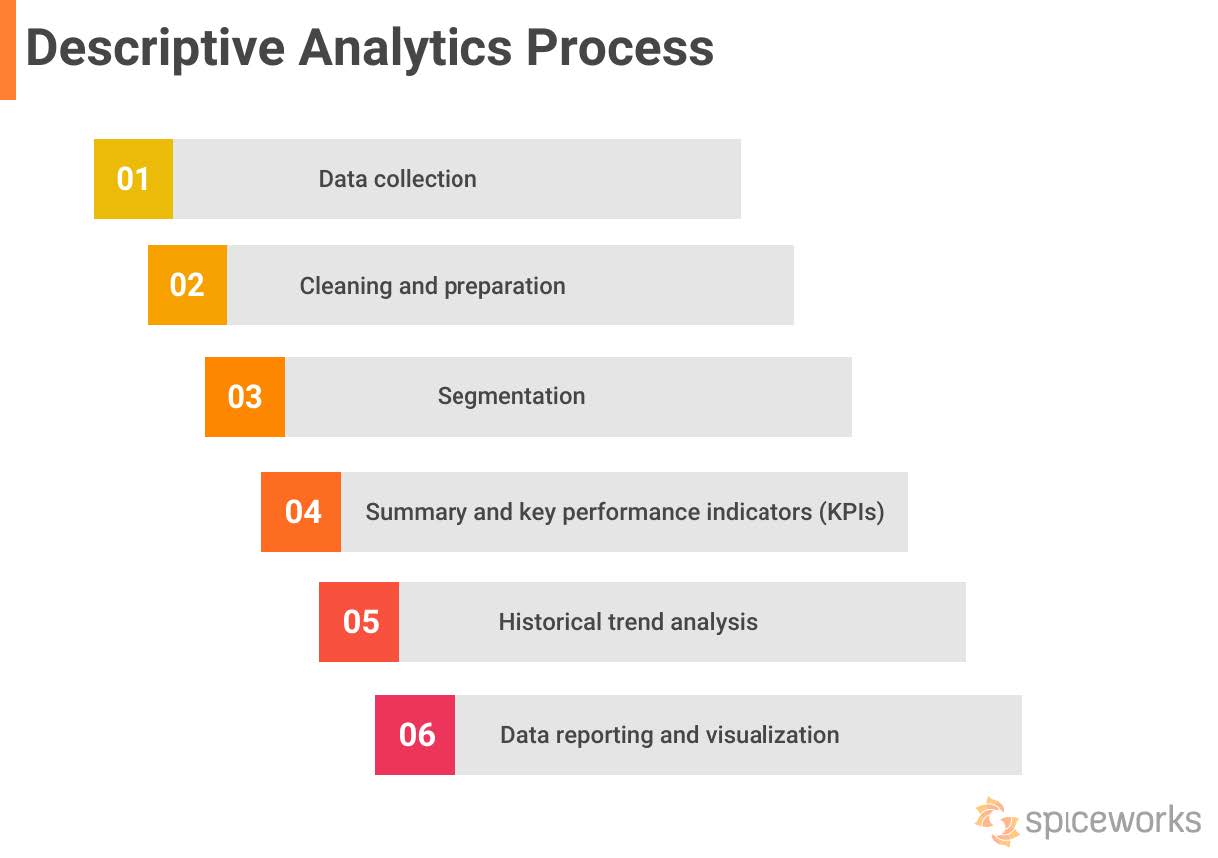
Extracting meaningful insights from the data takes time, technology, and effort. The descriptive analysis process includes multiple steps, the most critical of which include:
- Data collection: Gather relevant and comprehensive data from sources like databases, spreadsheets, surveys, and data repositories.
- Cleaning and preparation: Ensure data is relevant and high quality by reformatting and resolving issues like duplicates and inconsistencies.
- Exploration: Summary statistics, data visualization, and standard deviation help data analysts understand characteristics of the data and identify patterns and trends.
- Segmentation: Divide the dataset into subsets based on specific criteria for a more focused analysis.
- Summary and insights: Calculate relevant summary measures then identify metrics that help evaluate performance.
- Historical trend analysis: Look at how variables and metrics have changed over time to identify patterns in order to enhance decision-making, forecast future performance, and find potential areas of improvement.
- Data reporting and visualization: Communicate insights and findings through reports or visual dashboards.
- Continuous monitoring: Use regular updates to assess insights and findings and iterate on any data-backed strategies you’ve implemented.
Tools and techniques
Data aggregation and data mining are used in descriptive analytics to churn out data. Data mining is the process of understanding data through cleaning raw data, finding patterns, and creating and testing models. It includes statistics, machine learning, and database systems.
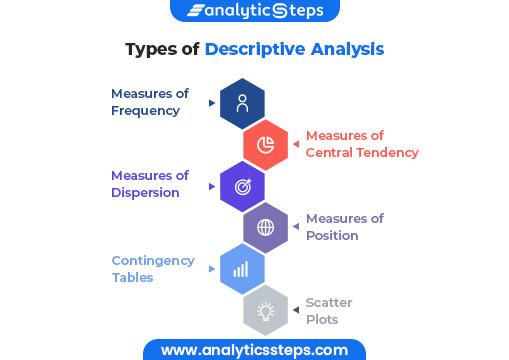
Then, tools and techniques like algorithms are commonly used to conduct analysis. Common algorithm types used in descriptive analytics include clustering algorithms, decision trees, association rules, regression analysis, and time series analysis. These methods, among others, help categorize measures of frequency, central tendency, dispersion, position, contingency tables, and scatter plots.

Data visualization tools and software
Descriptive analytics looks at raw data, then offers insights around that information. Data visualization is useful when sharing the findings and trends. Sharing information through graphics, charts, or tables makes the data more accessible and allows for cross-cultural communication. Read the whitepaper “Which Type of Chart or Graph is Right for You” to understand which format of visualization is appropriate for different insights and presentations.
Data software like Tableau is designed to help you build advanced charts that adhere to industry-standard analytical benchmarks and visualization types. Learn how to create a Pareto Chart, Population Pyramid, or calculate Z-scores using Tableau.
Examples of descriptive analytics
Before organizations can analyze what happened in the past, they need to gather large amounts of data over time. We’re sharing the stories of two companies who focused on garnering as much historical data as they could by creating dashboards. Their dashboards collected data points around internal factors like performance and budget but also external factors like industry standards and customer preferences. Using descriptive analytics, the organizations were able to study the data from the dashboards and identify trends. Understanding these insights helped them make data-informed decisions moving forward in many areas of the business.
NYU Langone Health
The medical center NYU Langone Health has utilized data analysis and descriptive analytics to improve the quality of patient care and experience. When planning out their vision for the future, they wanted to make data accessible and applicable to physicians and clinical leadership. They believe this would maximize productivity and collaboration in order to achieve better outcomes for patients.
NYU Langone did this by creating dashboards in Tableau. These dashboards allow users to easily sort and filter information. More than 100 dashboards use over 800 key performance indicators to track and analyze factors, including:
- Operational analytics like hospital resource capacity
- Patient census and lengths of stats
- Financial performance
- Industry trends
These dashboards offered NYU Langone a large amount of data points. By using descriptive analytics, they were able to utilize all of that data to understand what had happened internally, among patients and employees, and externally, in the healthcare industry and with their competitors. Finding trends and insights from that data helped them make better decisions moving forward.
In research, you often use storytelling to make your findings more engaging with people who aren't familiar. This skill has translated well to the hospital, where we look at data to tell us stories about how each patient is doing, and what trends we're facing on the macro level.
Bank Mandiri
Bank Mandiri is the largest financial institution in Indonesia. They’ve implemented a data-driven culture where every decision is based on reliable data. Their adoption of and commitment to a data culture is company-wide, training over 570 employees to use Tableau.
Bank Mandiri put an emphasis on descriptive analytics at the forefront. They used Tableau to establish over 600 dashboards and self-serve analytics. This helped them move away from spreadsheets to collaborate and communicate more effectively. Since becoming data-driven, they’ve increased the speed of information delivery from two weeks to two days.
Having access to so much data through the dashboards helped Bank Mandiri understand trends in both their customer's expectations and the financial services industry. With so many employees familiar with how to use the software, multiple departments are able to find insights in their historical data and better understand how to move forward.
Descriptive analytics vs. predictive analytics
Descriptive analytics and predictive analytics are both types of data analytics. While descriptive analytics answers the question “What happened?”, predictive analytics can help answer the question, "What is likely to happen?" They’re similar because they are both used to pull insights from historical data and can be very useful in business.
Descriptive analytics
Descriptive analytics looks at the past. It’s used to understand overall performance at an aggregate level as it relies on historical data that has been combined or summarized from multiple sources. It can help with complex comparisons and provide a foundation for analysis.
It can be used in business to analyze survey results, demand trends, market research, website traffic, and more.
Predictive analytics
Predictive analytics uses historical data and statistical models to predict the likelihood of future risks, opportunities, and outcomes. By providing forward-looking insights, it can help you make data-informed strategies and impactful business decisions for the near or distant future.
In predictive analytics, models and techniques are used to interpret historical data to make predictions about the future and identify upcoming behaviors. Some of the common techniques include employing regression models, classification models, clustering models, and time series models.
Data literacy is the future
Tableau is working to democratize analytics by helping people, with any skill level, to more easily interpret data. We offer several free, online data skills programs including:
- Self-paced trainings on Trailhead
- Data literacy guides for businesses
- Certificate programs
- Free versions of Tableau for students, teachers, and data activities for kids