Build your own custom territories in Tableau 10
Many of you have told us you’d like to create new geographic data using the data built into the geocoding database. And I am excited to announce you can do just that in Tableau 10 with our new custom territories!
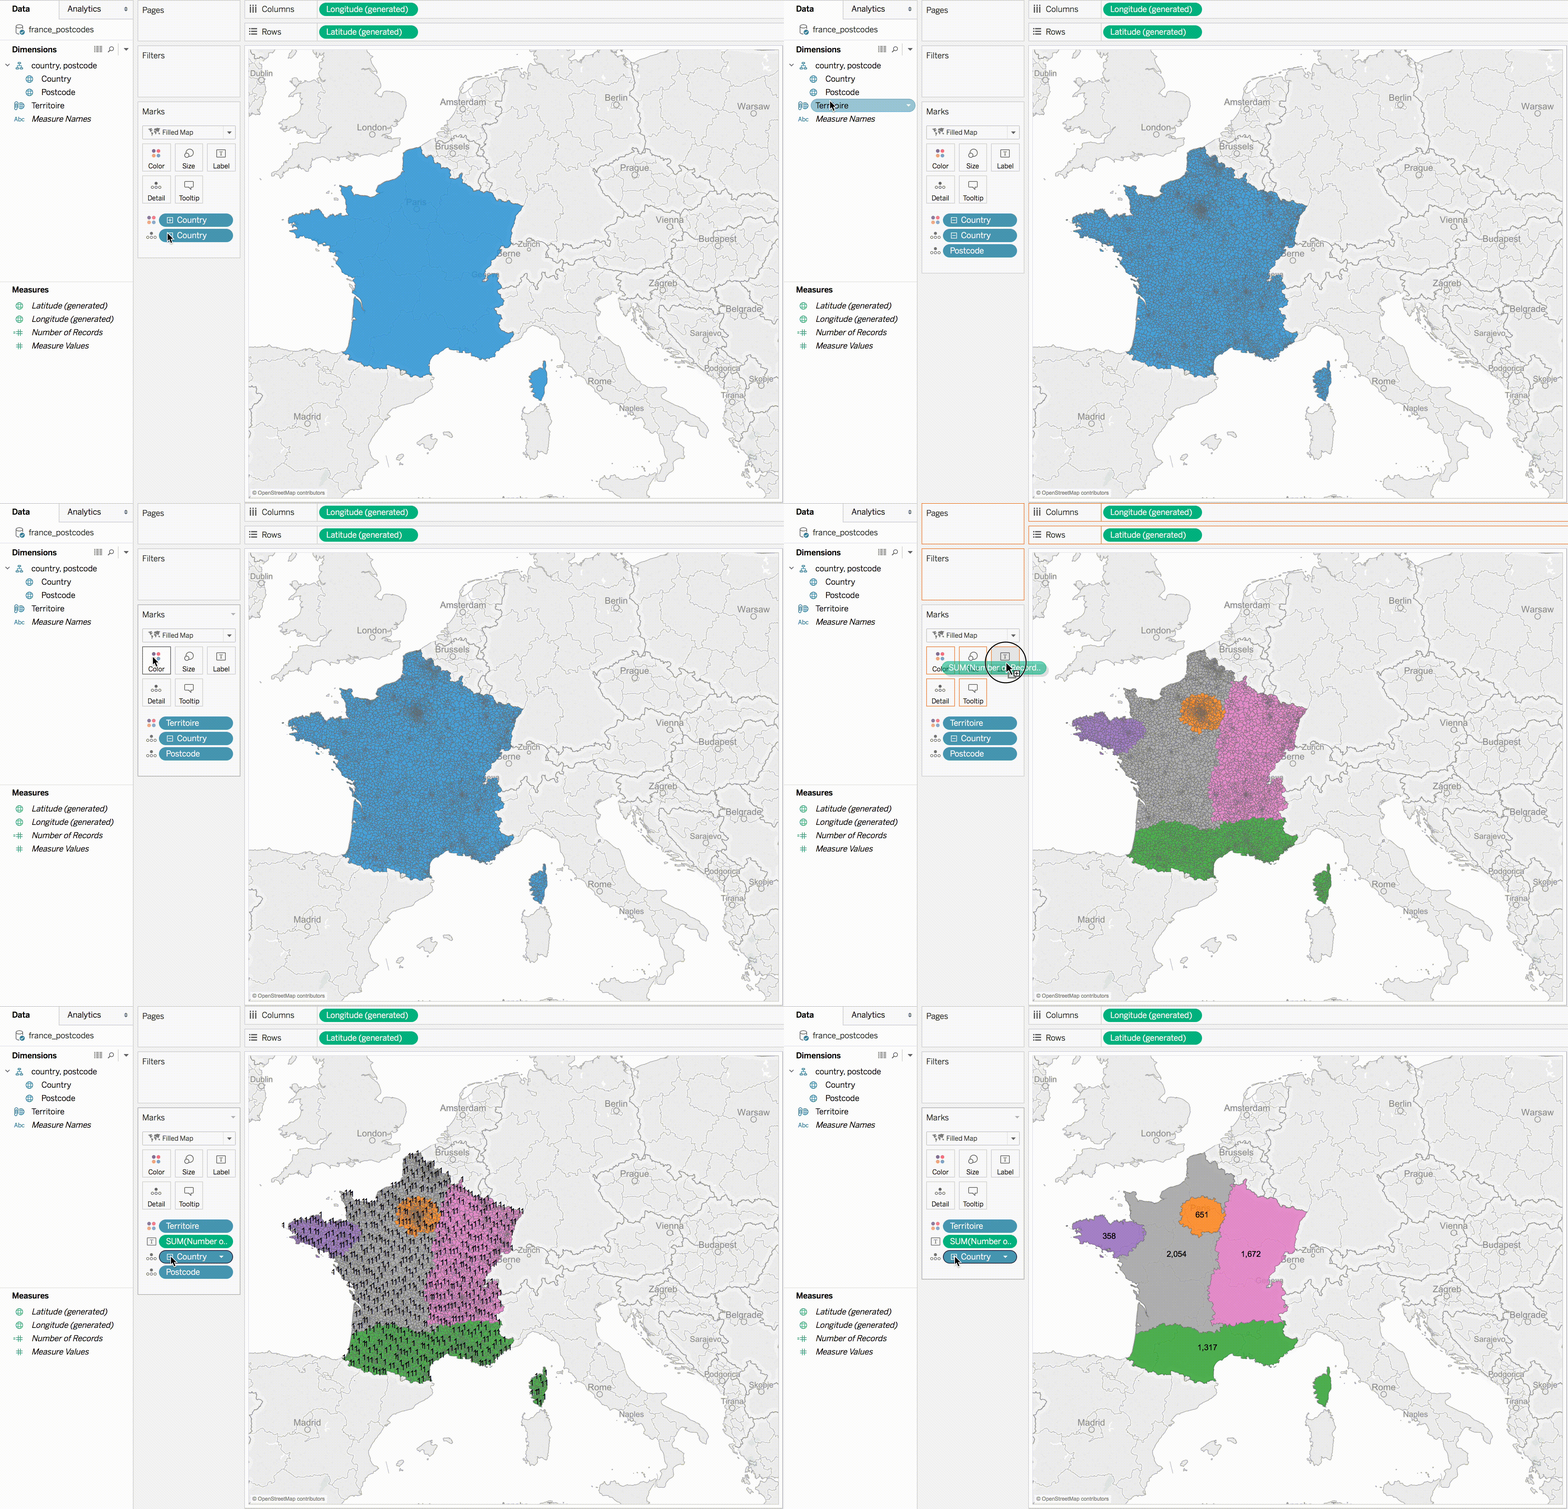
Update: Tableau 10 is here! Download now to try out the feature outlined below. Many of you have told us you’d like to create new geographic data using the data built into the geocoding database. And I am excited to announce you can do just that in Tableau 10 with our new custom territories! Let me explain how it works. The first thing to know is that there are two ways you can create custom territories: by using groups or by assigning a territory field as a geographic role. 1. Using groups Simply select marks on a map to create groups. Rename your groups to represent the names of your territories, and remove the lower-level geography from the viz. Voilà! Your custom territories will render on either a point map or a filled map. You can use the Edit Groups dialog to easily move features between groups. You can also turn “Other” on or off, depending on what you want to see in the viz. 2. Assigning a territory field as a geographic role When assigning a field to be a geographic role, you simply need to choose another lower-level geographic field to aggregate on. Let’s say you have a field called Sales Region in a table that includes postal codes. You can change the property of the Sales Region field to have a geographic role based on another geographic field. Once you do that, simply add the Territory field to a blank sheet and the magic happens. Your custom territories will draw on the map. (Please note: This option is currently not available in beta.)
How this feature might come in handy
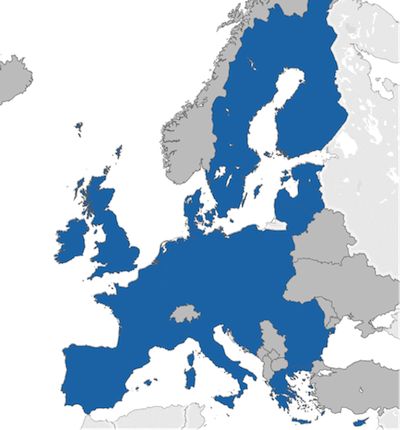
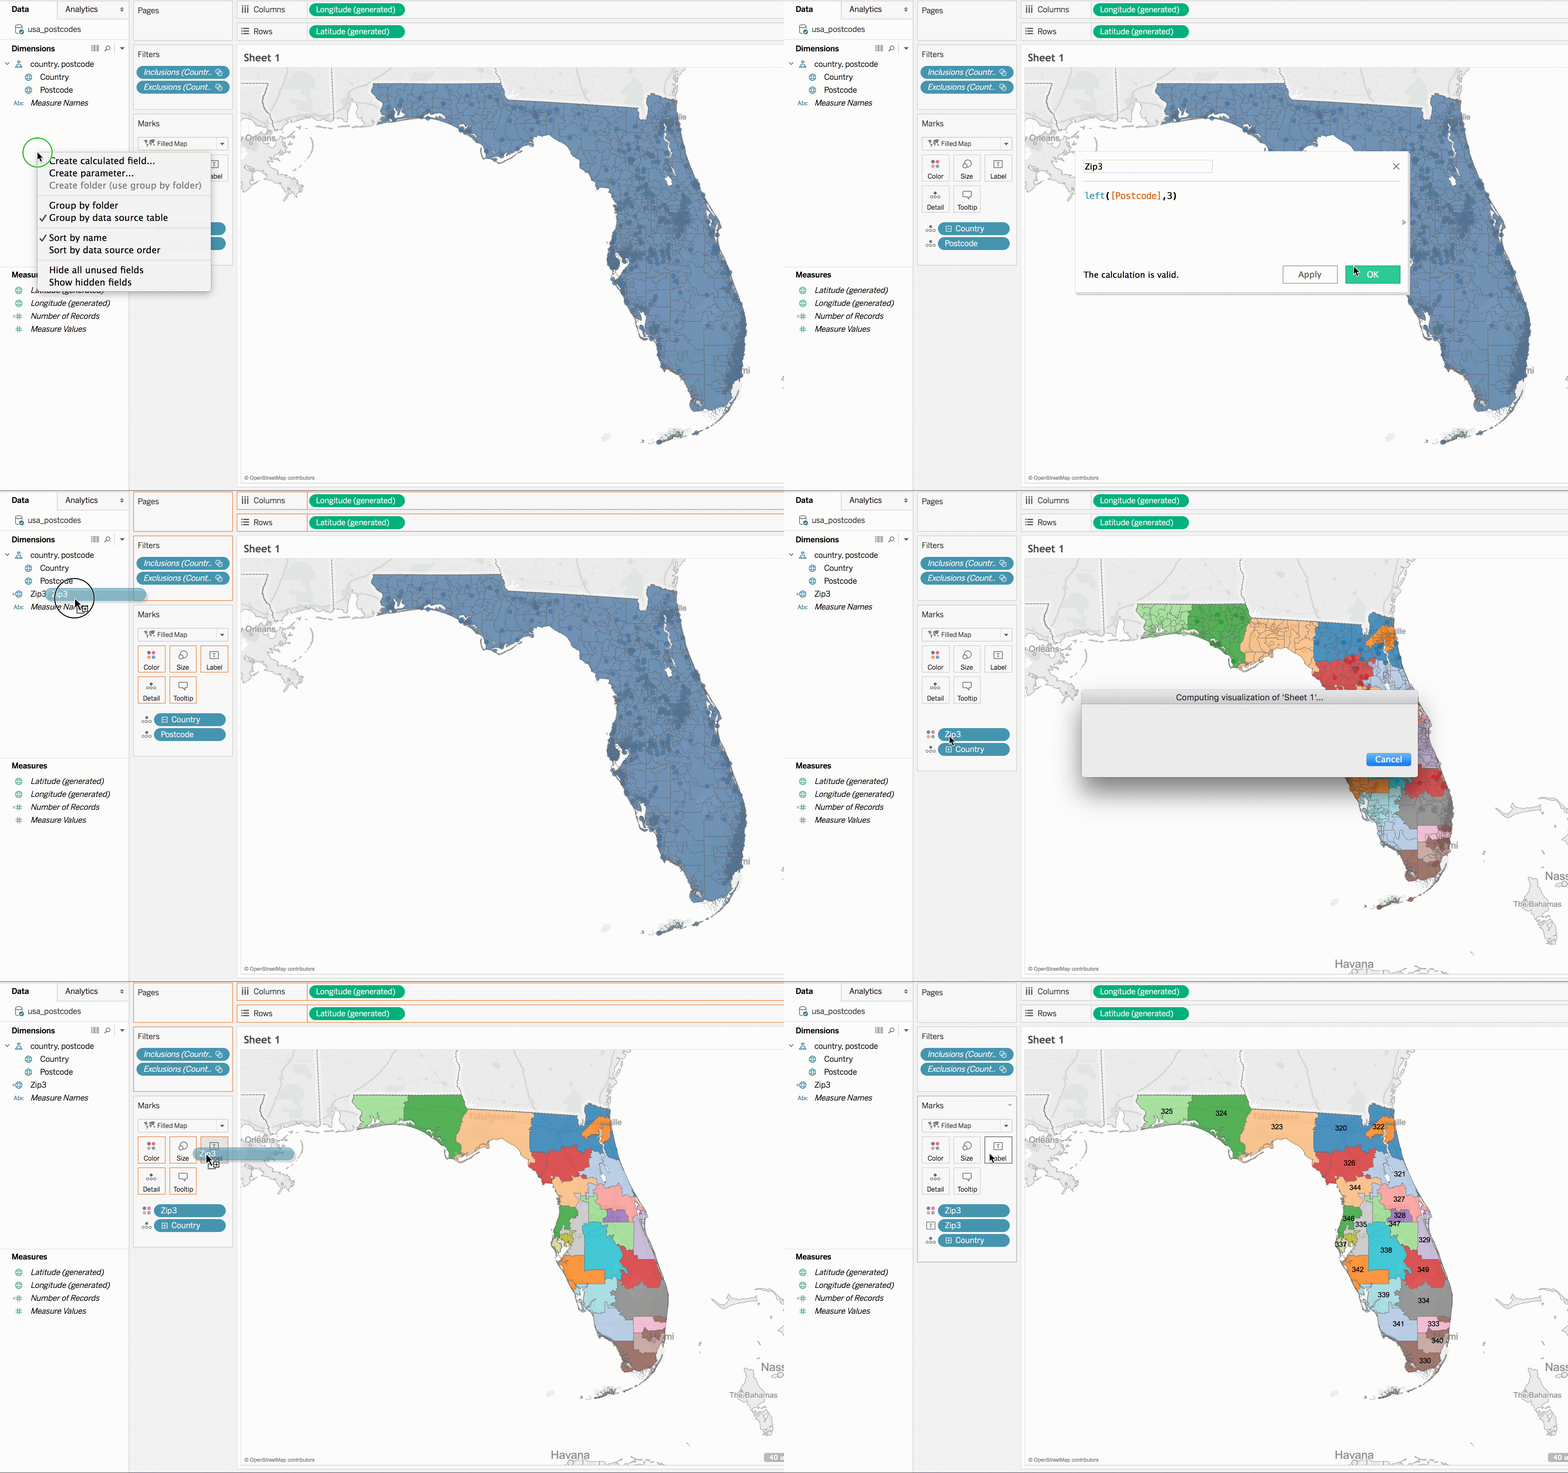
We can imagine so many use cases for this new feature. Here are just a few: 1. Show sales territories: Sales territories are often built on low-level geographies like zip codes, with groups of zip codes defining individual sales territories. It’s now fast and easy to construct these in Tableau.  2. Group multi-national regions: Do you want to make maps of multi-national administrative regions? No problem. You can now represent the European Union with a single mark.
  3. Aggregate postal codes: Use calculations to create three-digit zip codes in the US and postal code areas in the UK.
  4. Compare geographic territories: Leverage this feature’s exploratory power. Examine what-if scenarios at the regional level. Compare geographic territories with ease. Custom territories can be used with blending and data integration, so if your business data lives in another table, you can still visualize the data you want. Custom territories will work on point maps and filled maps. That means you can build proportionally-sized symbol maps and choropleth maps, just like you can with built-in geocoding data. You might be wondering about the difference between custom territories and groups. You’ve been able to group in Tableau for years, but those groups always sit on top of the base unit. That’s not the case with custom territories. You can build your own territories, and then use those as your base analysis. Under the hood, this feature is pretty complex. Imagine hundreds or thousands of polygons being unioned together, then dissolved to remove interior borders from adjacent polygons. Tableau is generating point centroids on the fly at lightning speed to keep you in the flow of your analysis. We’d like to thank you, our community, for helping us build this powerful feature. Your suggestions and votes on the Ideas Forum helped guide our work. As you know, your feedback means great deal to us.
Join the beta
Speaking of your input, we’d love your thoughts on the Tableau 10 beta! We have a timeline for getting Tableau 10 out the door, but we’d first like to get solid usage in beta and fix any bugs. We want your feedback as early as possible to catch any issues and ensure the new features are great. If you haven’t yet, check out our beta program to learn more and sign up. The beta program is available for existing Tableau customers. Customers with an active maintenance license can upgrade for free when Tableau 10 is released.
Learn more about Tableau 10
Tableau 10 includes a brand new look and feel, and a host of new features to help you prep, analyze, and share your insights even faster. Check out our Coming Soon page for details.
Answers through analytics
- Uncover patterns in your data with Tableau 10’s clustering feature
- Quickly find marks in context with Tableau 10's new highlighter
- Do more with bar charts in Tableau 10
- Tableau 10 includes more maps data, multilingual auto detection
Data breakthroughs
- Integrate your data with cross-database joins in Tableau 10
- As requested, you can filter across data sources in Tableau 10
- Do more with APIs in Tableau 10
- Tableau 10 includes even more data-source options
- Connect directly to Google Sheets in Tableau 10
- (Finally!) see and understand your IoT data with our Google Sheets connector
- Connect directly to your QuickBooks online data in Tableau 10
- Favorite your data sources in Tableau 10
Beautiful by design
- Check out the beautiful look and feel of Tableau 10
- Format your workbook with just a few clicks in Tableau 10
- How we designed the new color palettes
- Tableau 10 includes a new typeface designed for data
Delightfully mobile
- Design dashboards that shine on any device in Tableau 10
- Tips for designing device-specific dashboards that make everyone happy
- Manage your Tableau Mobile deployment with AirWatch or MobileIron
Do more on the web
- Author dashboards from scratch on the web in Tableau 10
- Do more while publishing workbooks in Tableau 10
- See a history of your revisions in Tableau 10
- What's new in Tableau Online
Self-service at scale
- Check out the new enterprise features in Tableau 10
- Extract-refresh fail? Get an email alert in Tableau 10
- Subscribe others to your views and workbooks in Tableau 10
Beta
Zugehörige Storys
Blog abonnieren
Rufen Sie die neuesten Tableau-Updates in Ihrem Posteingang ab.


