Advocacy Through Human-Centered Data Visualization


A human rights and legal advocate for more than 18 years, Shazeera Ahmad Zawawi has found her passion in data visualization along with new confidence in her untapped potential. “As a lawyer, I am trained to ask the right questions, investigate discrepancies, gather and analyze evidence, and think outside the box to solve cases,” says Shazeera.
These skills along with Shazeera’s artistic talents and a readiness to learn new things have propelled her success in data analytics. She’s now a Data Analyst at online financial services provider Swissquote, a Tableau Public Ambassador, and Co-leader of the Suisse Romande Tableau User Group.
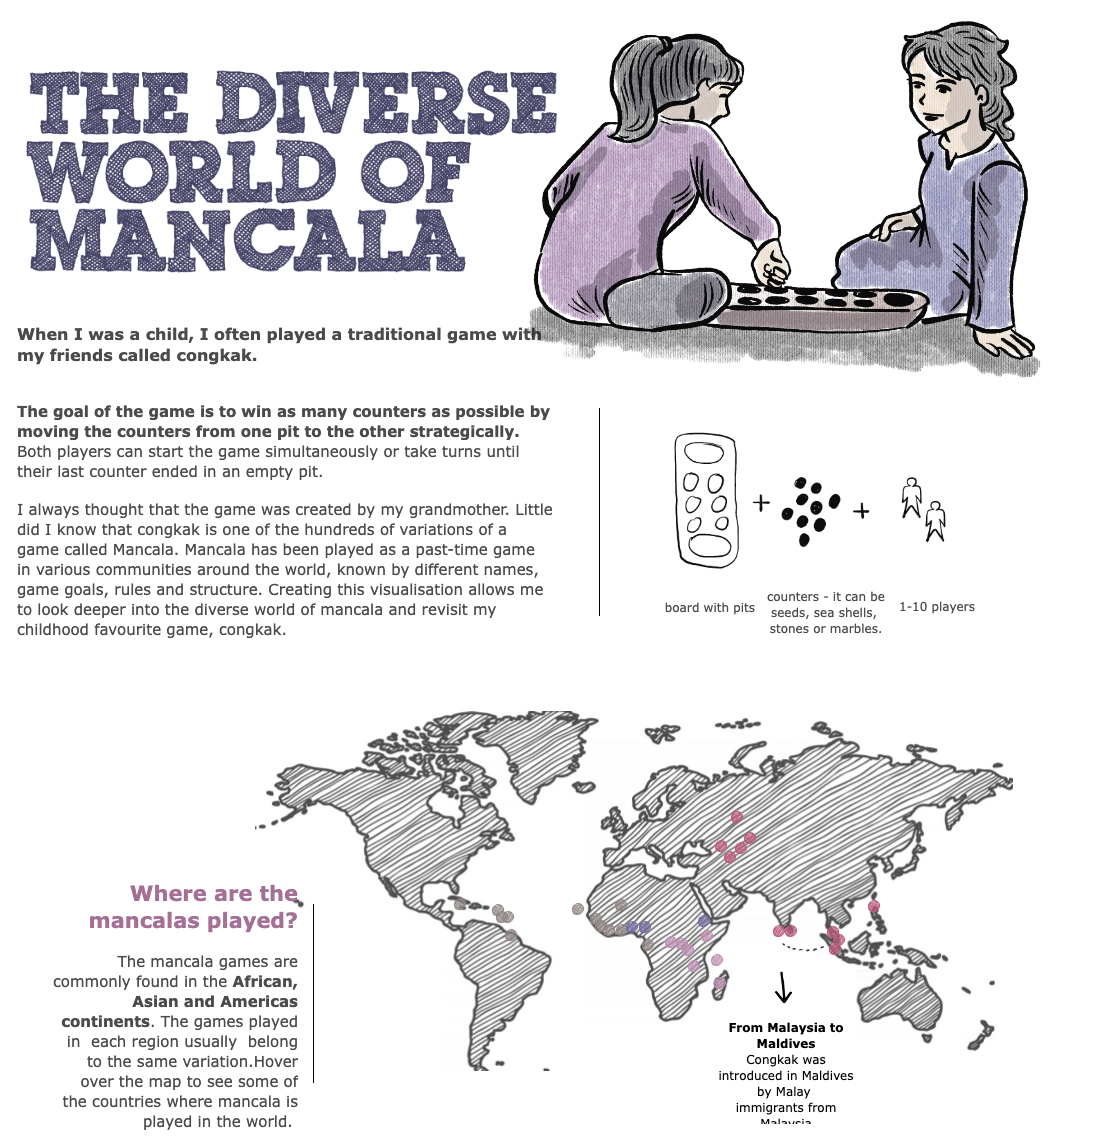
‘The Diverse World of Mancala’ on Tableau Public featuring Shazeera’s original art
Passion for data visualization sparks unexpected career
Shazeera never imagined she’d end up working in data analytics. “I performed poorly in my STEM subjects and never aspired to work with numbers,” she says.
However, Shazeera’s legal background taught her to rely on data and evidence to make arguments and communicate with different audiences. Still, she didn’t discover data visualization until the pandemic.
“I was a human rights advocate working for a Swiss organization called the Association for Prevention of Torture (APT). We were monitoring the situation of detention places globally and initially, we did not know what to do with the data we gathered,” she says.
Once introduced to the world of data analytics, Shazeera wanted to learn more and attended Tableau Conference and the Outlier Conference in 2021. There, she connected with the DataFam and was inspired to start her first data visualization project.
The project systemized and visualized all the data APT collected during the pandemic and made it available to torture prevention organizations globally.
“The project was so well received by all our partners that the United Nations Development Programme (UNDP) funded another data visualization project that I co-run with my colleagues for Latin America. These projects were my milestones embarking into the world of data analytics and I have never looked back,” says Shazeera.

‘Association for Prevention of Torture (APT)’ by Shazeera Ahmad Zawawi on Tableau Public
Creating impact while visualizing sensitive data with care
Shazeera stays true to herself by leveraging her professional data skills to shine a light on human rights issues. “My mission – it's like my tagline! – is to tell difficult stories,” she says. “I like to give a voice to the most invisible or unnoticed in society, the ones who are the most vulnerable.”
Shazeera acknowledges the importance of telling difficult stories in an ethical, responsible way that respects the people behind the data.
“In visualizing sensitive topics, I am mindful of the implications that my vizzes have on those affected. With human rights topics in particular, you are, more often than not, not only visualizing numbers but also someone's trauma, humiliation or violation. Hence, I always make sure that the data used is public data, comes from reliable sources, and does not include sensitive data that may cause reprisals to others,” she says.

Shazeera Ahmad Zawawi’s Human Rights section of her Tableau Public profile showcasing 8 visualizations
Shazeera’s additional tips on visualizing sensitive data include:
- Be mindful of triggering past traumas for survivors and family members and include clear disclaimers or warnings so audiences can make informed decisions on whether or not to view a viz
- Avoid stereotypes or cliches that reinforce certain stigmas or stereotypes – this includes researching particular words, terms, shapes, colors and visuals
- Include resources where audiences can go to for more information or assistance
Shazeera also highlighted the value of resources such as the Do No Harm Guide, Data Action: Using Data for Public Good, and Data Feminism. She has personally been inspired and influenced by these as well as Giorgia Lupi’s Data Humanism and her project with Stefani Posavec, Dear Data.
“I was drawn to Giorgia’s approach to data which is human, creative, and unconventional. She inspired me to include my own drawings and to always put humans at the center of my data visualization.”
Combining art and data with Tableau Public
Shazeera is an artist and has produced comics and cartoons on human rights and political issues for the past ten years. She uses her own illustrations within vizzes to help make stories more palatable and relatable for audiences. My State of Mind, a former Viz of the Day created on Tableau Public, is a great example.

Shazeera’s former Viz of the Day ‘My State of Mind’ on Tableau Public
“I believe that art is a universal language that can easily help people digest and be interested in complex information and I love the fact that Tableau allows me to bring my creative side into what I do,” she says. “It enables me to visualize a broad range of data, including my personal data projects, with the freedom to apply creativity and approach to design. Speaking to any fellow creatives out there, there's no other platform I know of that allows you to engage with other artists, build on each other's work, and get constructive feedback.”

Shazeera Ahmad Zawawi’s ‘My Data Journey’ on Tableau Public
Shazeera is also passionate about engaging with and learning from the Tableau Community which she refers to as her anchor and the best supporter for her move into data analytics.
“There are just so many learning resources in the Tableau Community and it is up to you to utilize them, depending on your own learning pace and goals.”
Zugehörige Storys

DataFam Roundup: April 28-May 2, 2025

DataFam Roundup: April 21-25, 2025

Transforming Ideas into Features: Tableau's Commitment to Community-Driven Innovation
 12 April, 2025
Blog abonnieren
Rufen Sie die neuesten Tableau-Updates in Ihrem Posteingang ab.