Curling, Korea, and Eddie the Eagle: Visualizing interesting (and curious) facts about the Winter Games.
Interesting fact of the week: mixed-doubles curling, also known as Coed curling, is now an Olympic sport. Next week in Pyeongchang, it will star at the Winter Games for the very first time in Olympic history, along will mass-start speed skating, mixed-team alpine skiing and big air snowboarding.
The Winter Games are always great fun, and provide lots of vizpriration for the data viz enthusiast. If winter sports and anything to do with data are your cup of tea, why not share your vizzes on Twitter using the hashtag #WinterGamesViz! We can’t wait to see what the Tableau community will create!
In addition, Tableau data artist Jonni Walker is also giving out some swag for his favorite #WinterGamesViz that looks at some of the less familiar sports and curious stories in the winter games.
To get you started we have collected a few resources that you might find useful.
Data:
The official results of the different competitions will be posted on the game’s website. You can also find them on Wikipedia.
The medal table too will be on Wikipedia (or directly use this table on Google Sheets that we have prepared, for use in this viz.)
If you want your viz to reflect the latest results you can do so via the google sheets connector, as described in this blog post.
To look at previous installments of the Winter Games, the Sports Viz Sundays page on data.world has data for the medals by country and medals by athlete. (Use #SportsVizSundays when sharing your vizzes that use this dataset.)
Some other data sources to consider:
https://www.sports-reference.com/olympics/
https://www.statista.com/search/?q=Olympic+Winter+Games
https://www.olympic.org/olympic-results
https://www.kaggle.com/the-guardian/olympic-games
Flags and pictograms:
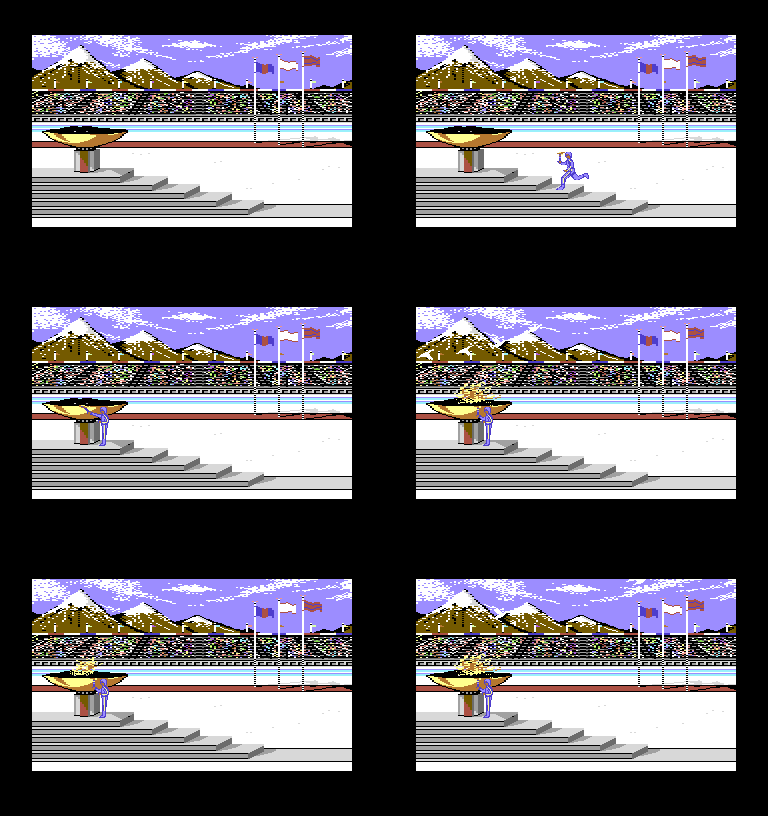
Fans of the Epyx “Winter Games” computer game, will remember how fun it is to choose which flag you want to play for. If you need some country flags for your viz, you can download the images from Wikipedia, here.
There are some very interesting flags in this set, such as the ones for Chinese Taipei, the Olympic Athletes from Russia, or the unified Korean team that will bring together the two halves of the country to compete in ice hockey as one team.
In addition to flags, you might also want to use some pictograms to represent the different sports, including mixed-doubles curling. The official pictograms can be seen here.
Wikipedia also has some generic pictograms that you might want to download.
Both the flags and the pictograms can be used as marks in your visualization. Here is a short description how to do that.
Inspiration:
We have started putting together a list of vizzes around the winter games that we liked. (No surprise: Jonni’s favorite viz on there is the one about Eddie "The Eagle", who competed for Britain in the ski jump competition in 1988.)
Have a look, and maybe you will find something there that sparks your imagination. Remember to share your vizzes - whether serious or tongue-in-cheek - using the hashtag #WinterGamesViz
Let the vizzing begin!

Image: Wikipedia
Related Stories
Subscribe to our blog
Get the latest Tableau updates in your inbox.


