Mobility metrics provide unique insights into COVID-19
“Mobile phone data, when used properly and carefully, represents a critical arsenal of tools for supporting public health actions across early-, middle-, and late-stage phases of the COVID-19 pandemic.” – Science Advances, publication of the American Association for the Advancement of Science
Data that’s related to human mobility is helping decision makers understand how infectious diseases spread, and assess the economic and social impacts locally and globally.
In the public and private sectors, aggregated and anonymized data from mobile devices is used with other web-based data sources including social media, search engine queries, and traditional public health surveillance data to inform critical analyses, policies, and decisions:
- Healthcare and research organizations analyze mobility data to help build predictive epidemiological models.
- Government agencies use near real-time mobility data to determine the effectiveness of shelter-in-place, social distancing, and other non-pharmaceutical, or NPI, public health measures.
- Companies like Expedia Group leverage mobility data to identify external indicators that affect their business and their customers.
- Economists analyze mobility data to assess how quickly people are returning to normal patterns of activity, to help determine economic impacts.
Detecting patterns in human activity with mobile phone data
On January 30, 2020, the World Health Organization declared COVID-19 a global public health emergency, accelerating the demand for detailed geo-spatial information. But this isn’t the first crisis to put mobility data in the spotlight. In fact, mobility data was used to monitor the H1N1 pandemic in Mexico in 2009, predict the spread of cholera in Haiti in 2010, study impacts of travel restrictions to contain Ebola in Sierra Leone in 2015, and to assess population recovery following natural disasters, like Hurricane Maria in 2017.
In the COVID-19 era, experts are stressing the importance of using mobility data in the fight against the virus. In the paper, “Mobile phone data and COVID-19: Missing an opportunity?” co-authored by renowned data scientist Nuria Oliver, the authors explain how mobile phone data can and should play a key role in combating the pandemic. With mobility metrics, it’s possible to answer questions across four broad categories of inquiry:
- Situational awareness: How are people moving across geographies? What areas are showing higher concentrations of disease? What are the significant trends?
- Cause-and-effect: What variables determine success of social distancing approaches? What are the social and economic impacts of movement restrictions?
- Prediction: How are mobility patterns likely to affect virus spread? What implications do mobility restrictions have on children’s education outcomes? Where is the next hot zone?
- Impact: What is the potential of various restrictive measures to save lives? Has public safety information changed mobility behavior?
Real-world analytics: what the data is telling us
In a fast-moving pandemic, speed-to-insight is key, and mobility analytics are providing the kind of real-time, actionable information that’s needed for effective decision-making. A variety of research institutions and firms are using this data to learn more about the ways human behavior amplifies the impacts of the virus.
Consumers “vote with their feet”
With its anonymized data set of foot traffic counts and visitor insights, SafeGraph is able to track consumer metrics that reveal an uneven, fluctuating recovery. From January to April, their data indicates traffic at retail and food establishments was down 55%, with a gradual uptick that slowly started to reverse by the end of June. Metrics like this, used in tandem with data pertaining to credit card use, consumer stimulus spending, and virus resurgence, are helping economists understand trends and forecast future economic impacts.
Bar re-openings and increased test positivity rates
Research has shown that proximity plays a role in virus transmission, and these findings are also reflected in mobile phone data. Cuebiq, a mobility analytics firm, used smartphone data from its dataset of 15 million, location-enabled phones to explore how bar re-openings relate to virus spread. Their findings revealed a correlation between foot traffic in bars and positive COVID-19 cases within a week of bars reopening in three hotbed states: Florida, Arizona, and Georgia.
Spikes in hospital admissions
At University of South Florida’s College of Business, Dr. Matthew Mullarkey and fellow researchers have found a very direct correlation between increases in mobility and pressure on hospital systems. “It turns out that as mobility to multiple, unique locations per day rises and as the number of dense locations we visit rises we see an immediate effect in about three weeks’ time on the hospital admissions and pressure on hospital admissions for COVID patients,” according to Dr. Mullarkey.
Detailed insights for decision makers
Academic researchers and humanitarian organizations are tapping into the extensive mobility data resources from Google’s Community Mobility Reports, Facebook for Good, and the COVID-19 Mobility Data Network, which links infectious disease experts and data scientists who provide analytical support to public health officials and decision-makers around the world. Policymakers are able to use this granular data to assess whether mitigation measures—including shelter-in-place, physical distancing mandates, and phased business re-openings—are working.
Visualizing mobility metrics with Tableau
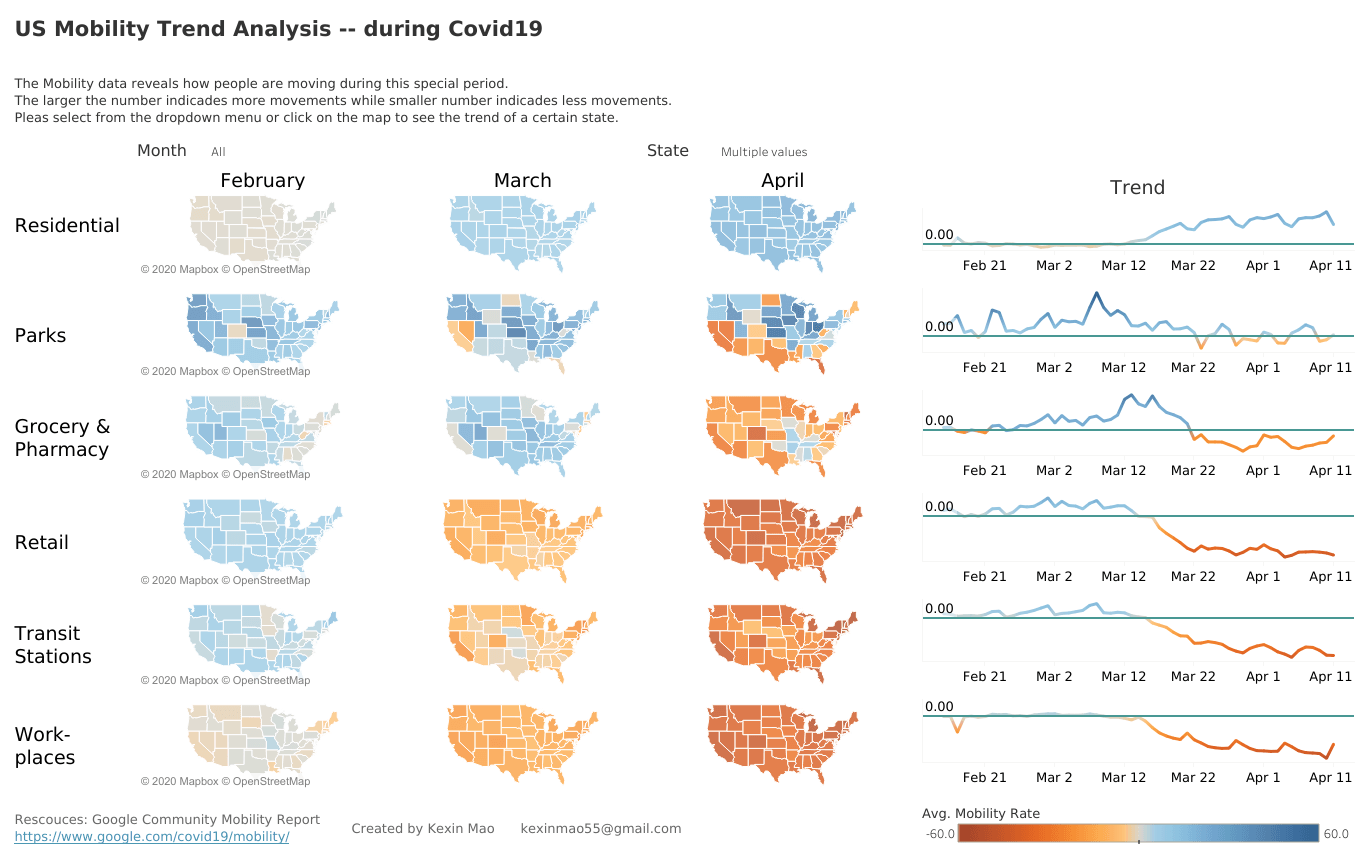
Using Tableau, it’s possible to aggregate and analyze COVID-19 mobility data and explore trends for deeper insight. In the example below, Kexin Mao uses Google Community Mobility Report data to visualize state-by-state movement patterns and compare where people are going and how that deviated from the pre-pandemic norm.

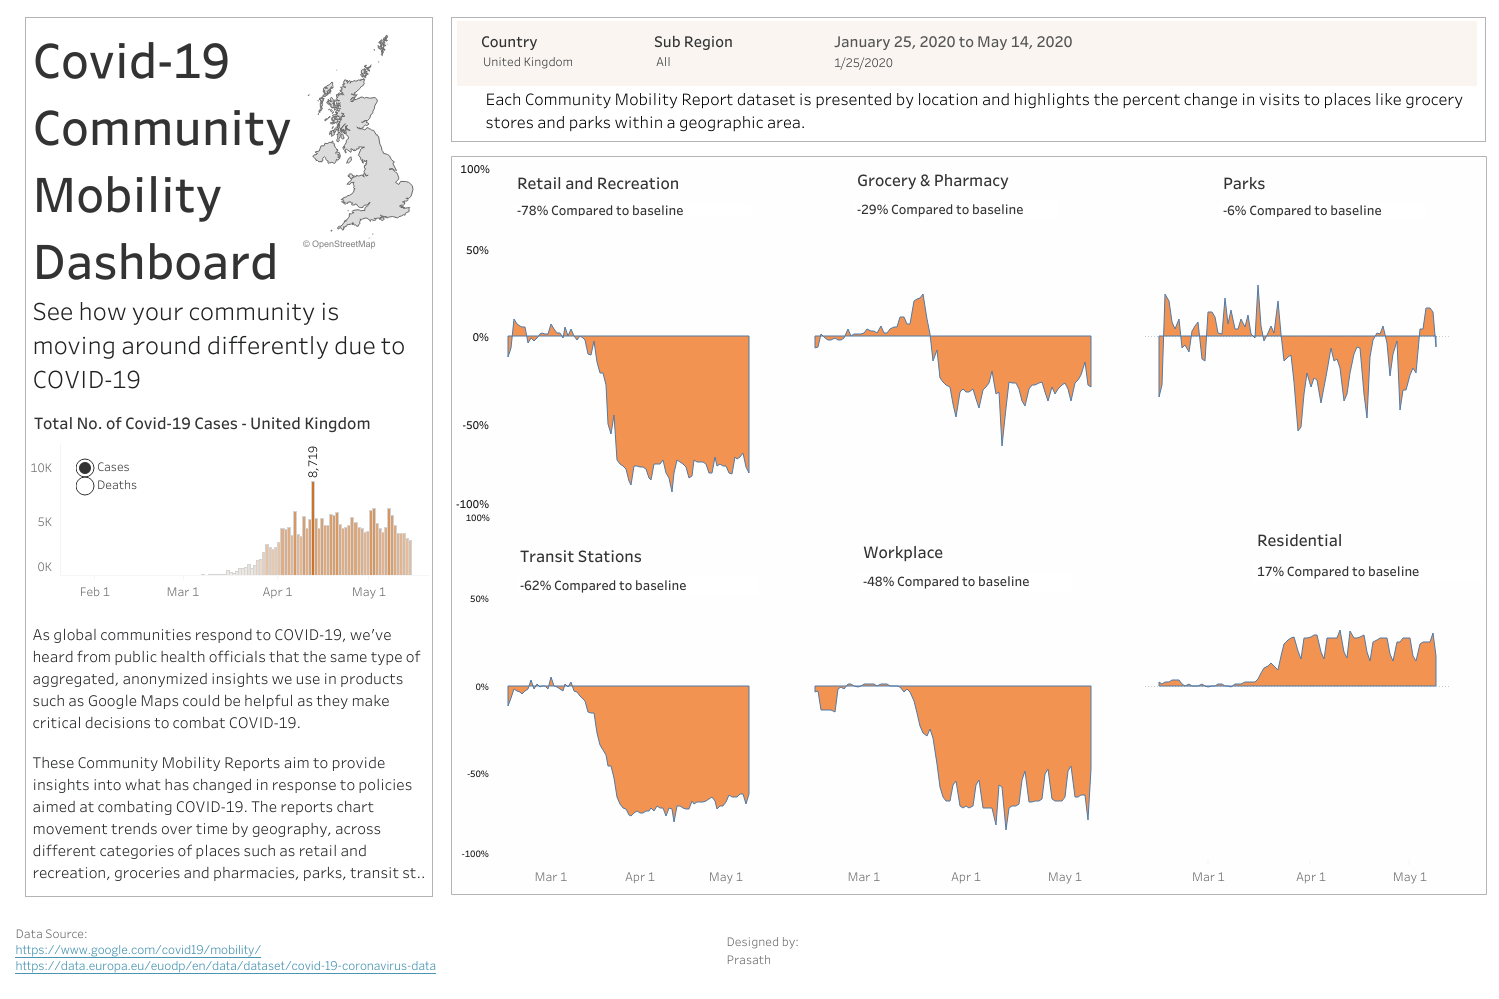
Here’s a viz by Praseth N that uses the same data source, offering a global perspective on movement patterns.

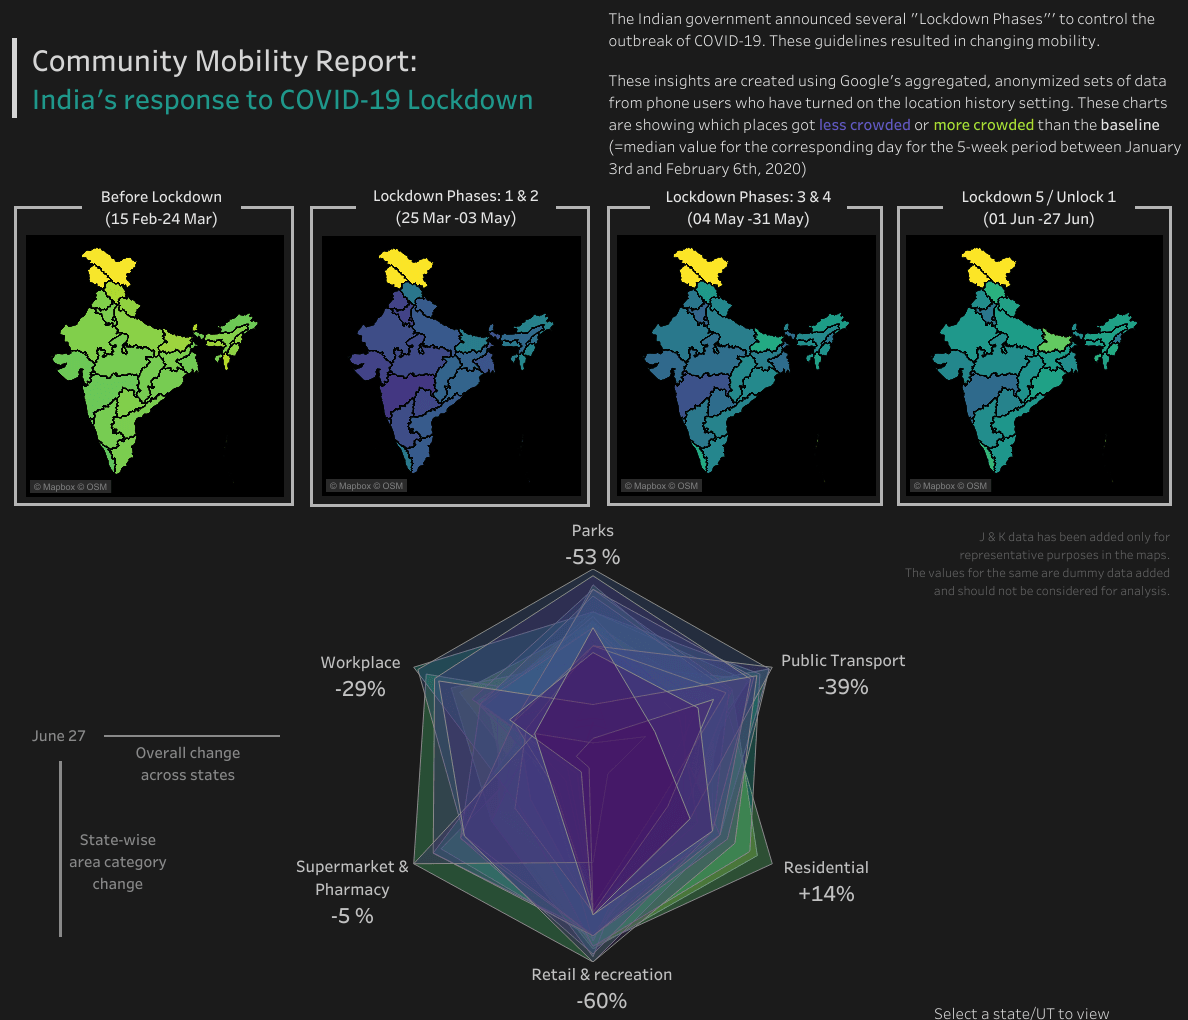
In this viz, Riya Surendran also used Google data to focus on impacts of the lockdown in India, showing places that got less crowded and more crowded, and the states with the highest changes in overall mobility.

Understanding begins with data
Human mobility is the leading factor in the spread of infectious disease, and understanding how, where, and why people move is fundamental to understanding diseases like COVID-19. The current pandemic has underscored how important it is to have accurate, realtime insight into the nuances of human mobility, because public health policy and economic resilience depends on it.
As we navigate through the coronavirus and beyond, rapid understanding of complex information is enabled by powerful, data analytics. Learn more about how your organization can build resilience and make better decisions with Tableau.
Related Stories
Subscribe to our blog
Get the latest Tableau updates in your inbox.


