How to Make (and Save!) a Custom Mapbox Map for Your Viz
Note: The following is a guest post by Tableau Zen Master Anya A'Hearn.
As you know, Tableau 9.2 comes with Mapbox integration. And once you've tried the preset maps in Mapbox, the next step is to make a custom map. Seriously, this is going to rock your Tableau map world.
If you haven't yet, sign up for a free Mapbox account and download Mapbox Studio Classic.
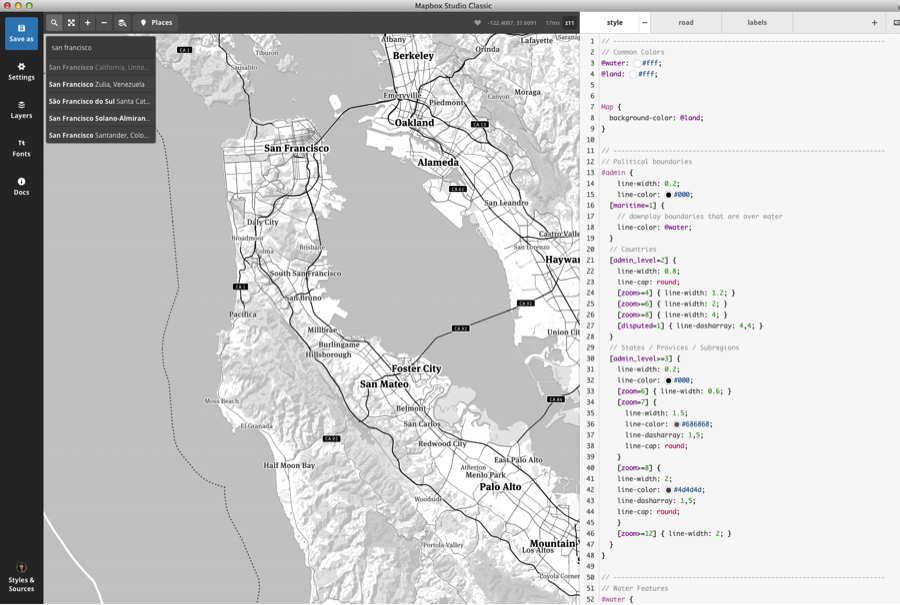
Open the program and select one of the map styles to use as the base layer for your map. You could also start from scratch, but this is all about getting to fabulous fast! For this tutorial, I am going to pick “high contrast,” but feel free to select whatever you’d like.

Once you have selected the base, you can use the looking glass to search for a city or area that may be of interest by typing it in the search box. I, of course, will be using my favorite city, San Francisco.

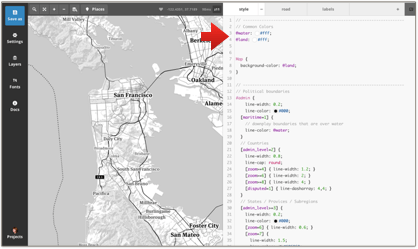
Now, before going any further, make yourself a snack and open a bottle of wine, because this is where the fun begins. You may very well find yourself sucked into playing with your new map super powers for hours. Click on a little circle that has color in it. Pick a good one, like water or land. Go on, make them hot pink or whatever color you’d like.

You can also just enter a hex code for the colors if you need an exact match. I, of course, am going to use the colors of my San Francisco Giants. I got the exact colors from a fun site called teamcolors.arc90.com. Now hit the save button in the upper-left corner of the screen. Notice the map update right away!

You can change fonts, colors, line opacity, thickness, etc. and specify the details for various levels of zooming in and out.
One helpful hint is to copy all the code and paste it in TextEdit so you have a backup in case you mess up. You can also type ” //” at the beginning of a line to comment things out and test what it looks like before you delete them.
So by now a few hours have probably gone by and you have something fun like my SF Giants map style.

Time to upload your work of art so that you can use it in Tableau! Click on the setting button on the upper left corner, and then upload to Mapbox.
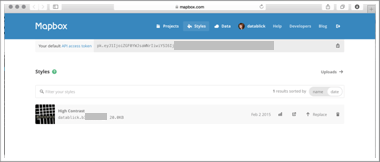
After you click on upload, find the Map ID right above the upload button. This will have your username plus a bunch of letters and numbers after it. Copy and past that in a TextEdit file for use in a minute. Click on that MapID and you should be taken to Mapbox.com.
Open a new workbook in Tableau 9.2 and pick your data set. If you don’t have one, Superstore data will work just fine. Add a geographic dimension and a metric. Then go to your Map menu and select Background Maps, and then and select Map Services.

Click on the add button and then, there it is! WOOT! The magic Mapbox Maps button.

Give your map a style name and add in your API access token, which you can find on your account page.

Choose custom, and paste in the MapID you grabbed in Mapbox.

Go back to the Map menu and your beautiful new, multi-layered map will now be in your list of background maps! Go ahead. Select it!

And now you can turn your Mapbox map into a Tableau viz!
Bonus: How to Save Your Mapbox Map
Now, for some extra fun. Tableau Zen Master Allan Walker discovered this about 10 seconds after getting Tableau 9.2.
Go back to your Map menu and select Map Services. Highlight your new map and click the export button.

You will be prompted to save a copy in your Mapsources folder, and after you do, you will be able to use this map in any viz of your choosing!
Ready to dive deeper into Mapbox? Check out my tutorial on creating multiple custom map layers in Mapbox and watch this Think Data Thursday webinar on Mapbox..
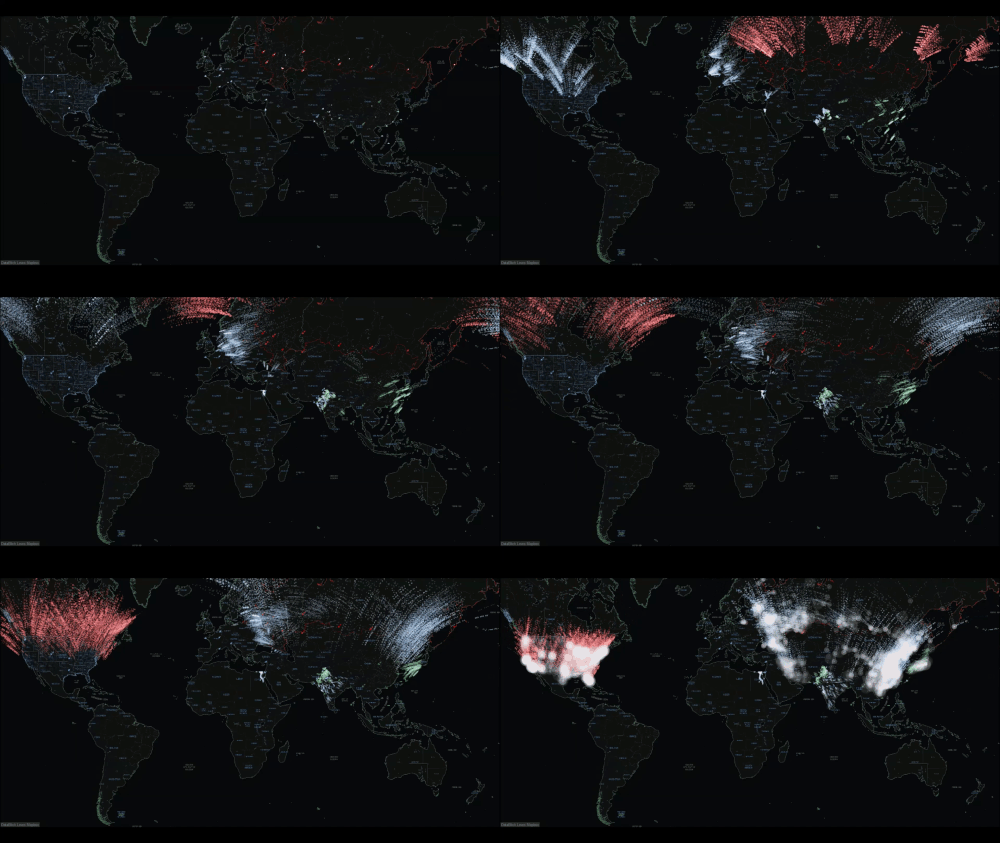
To have your mind blown by the possibilities of Mapbox + Tableau, check out this WarGames replica by Allan Walker, Jeffrey Shaffer, Chris DeMartini, and myself. Here's a preview:

How are you using Mapbox and Tableau? Do share in the comments below!
Subscribe to our blog
Get the latest Tableau updates in your inbox.


