Beyond the Fitbit: Quantifying Forgiveness, Gratitude, and Beyond
Note: This guest post by Emily Kund is part of our series on the quantified self. Emily co-hosts the Tableau Wannabe Podcast. In the first installment of our series, we explored the trouble with dead-end dashboards.
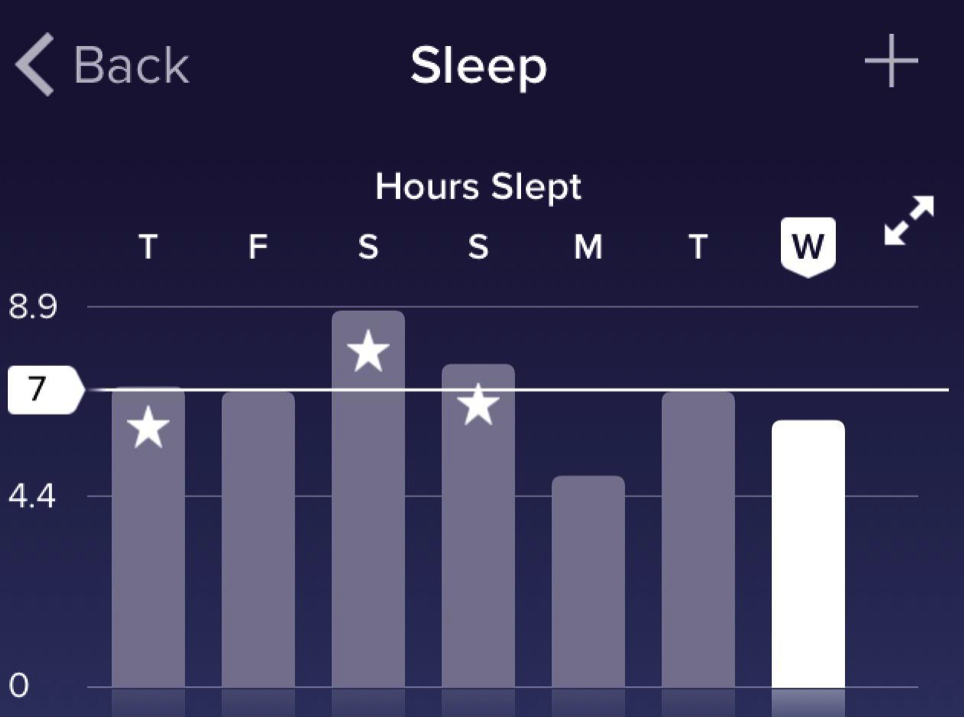
It started with a Fitbit in 2014. I monitored my steps, measured my progress, and tried to win challenges. I eventually started tracking my sleep as well, and my Fitbit data helped fuel meaningful discussions with my doctor.

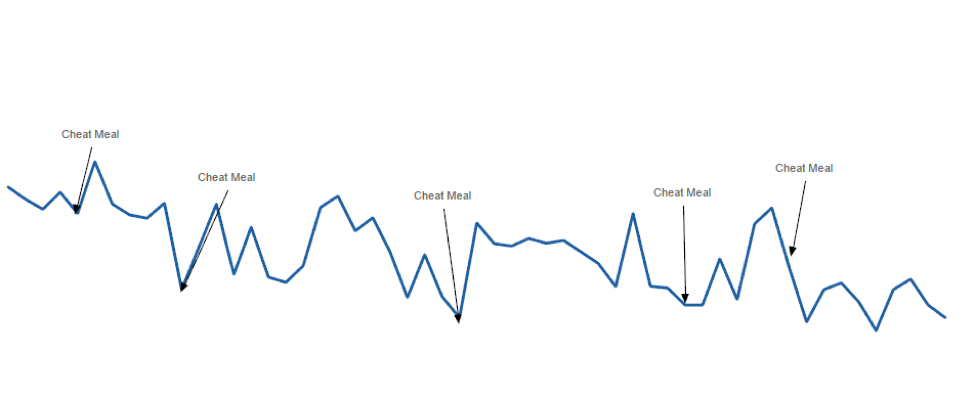
Then my quantified-self curiosity bloomed. I started working with a trainer, and I wanted to better understand the effects of cheat meals on my weight-loss goals.
I assembled a simple spreadsheet that listed my cheat meals by date, and opened this data in Tableau. Then I used the Fitbit Web Data Connector to grab data on my weight, which I track using the Fitbit Aria scale. I married the two data sources, visualized my weight, and annotated my cheat meals.

A Castaway on Quantified-Self Island
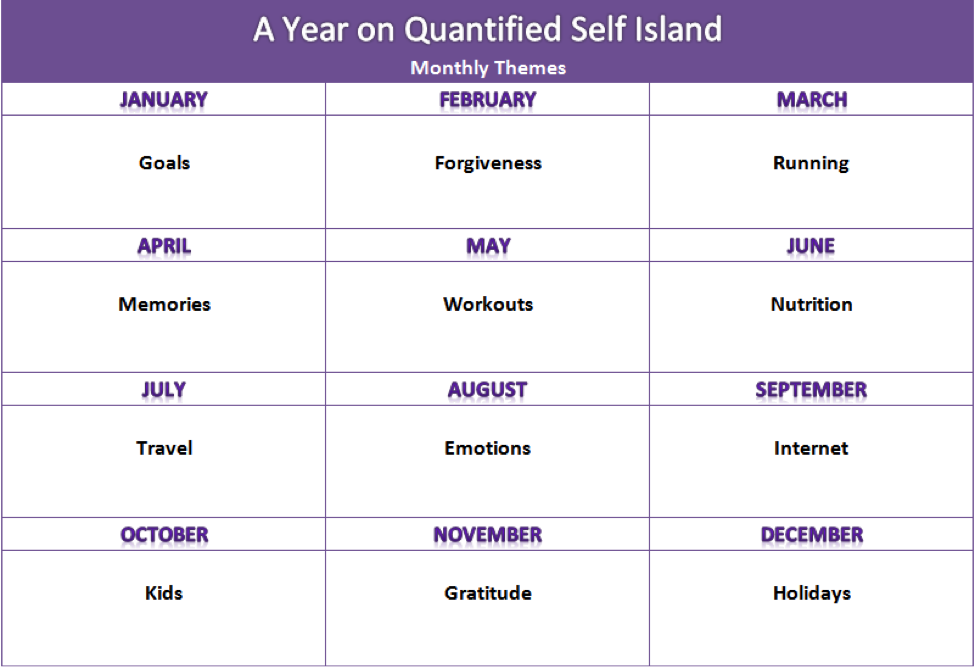
Do I consider myself a quantified-self enthusiast? Not really. I don't track every little thing about myself. But I am curious about some aspects, and I do think it will be kind of fun to visualize the data. So I came up with the idea of Quantified-Self Island (QSI) for 2016. Each month, I'll visualize and explore data about myself based on that month’s theme:

Since there isn't an Emily database just waiting to be connected to and visualized, I'll have to figure out the most convenient way for me to track data for each theme.
Quantifying Forgiveness, Emotions, Gratitude
For this month’s theme of goals, I’m tracking my tiny habits for two weeks with a specific focus on water. Tiny habits are little actions that can help lead to bigger change. My big goal is to drink 128 ounces of water per day. I’ll use Google Sheets to track my data which includes the date, the habit, and whether I performed that habit. Once I have the data, I’ll use a Web Data Connector to connect to the data and explore it in Tableau.
I like the idea of visualizing forgiveness, which I thought would be a great challenge. I’m still piecing together how I might track this. My initial thoughts are to use Google Sheets to track all of the conditions around when I say I’m sorry or when I forgive someone. Those data elements might include: the date, time, the subject, the person(s) involved, and who I apologized to or forgave. I can’t wait to see what insights this will yield!
Another theme I’m interested in exploring is memories. How the heck am I going to track this? I think the best/easiest way for me to do this is to track my memory metadata (the who, what, where, why, and when) of memories that pop up on Facebook or via TimeHop. I love digital scrapbooking, and I can totally see that as a potential design influence.
As listeners of the Tableau Wannabe Podcast know, I can be pretty emotive. I think it will be interesting to gauge my range of emotions. I set up an IFTTT recipe last year that collects my tweets based on certain criteria. I’ll most likely leverage that data to visualize my emotions. Or I might just go old school-ish and track the conditions around when I’m feeling certain strong emotions (like frustration, excitement, annoyance, and bliss).
Gratitude will be another fun topic to explore. There are so many ways I could track this subject. I could track when I express my gratitude towards others (as in, “I am thankful that you are in my tribe”), when I simply say thank you, or how many times I say a prayer of thanksgiving.
Message in a Bottle from Quantified-Self Island
My goal is to track and then visualize my data to uncover insights and better understand myself. But my project won’t end there; l’ll go one step further to share my findings with someone else. I’ll draw up a message and actually mail it to someone so he or she can see my data (akin to the Dear Data Two project or the Data Chain Mail project but with no exchange). In a way, this will be my message in a bottle sent from Quantified-Self Island.
I think this is a great way to connect with people. While I love social media, wouldn't it be cool to actually receive a letter? Someone is less likely to scroll right by it, and maybe the gesture will strengthen a connection or jump-start a conversation.
I hope to deepen connections with the people around me. If that sounds like you, then, my dear guests, I am your host, and welcome to Quantified-Self Island!

What types of quantified-self data are you collecting and exploring? And what tips and tricks do you have for collecting data? Do share in the comments below!
For updates to Emily’s quantified-self project, follow her blog, Wannabe Awesome Me.
Subscribe to our blog
Get the latest Tableau updates in your inbox.


