Iron Viz 2024: Tune into TV Data with IMDb


Tableau Conference attendees and viewers worldwide experienced an inspiring showcase of data storytelling—the Iron Viz 2024 Championship. It's the ultimate showdown where competitors go dashboard-to-dashboard, racing against the clock to craft a visualization in just 20 minutes. Who will be crowned best-in-viz and take the 2024 Iron Viz Champion title? Hold onto your bar charts to find out!

Iron Viz hosts Senior Data Evangelist Andy Cotgreave and Solution Engineering Program Manager Archana Ganeshalingam cranked up the excitement as they introduced this year’s powerhouse finalists: Jessica Moon, Chris Westlake, and Pata Gogová. To support these data rockstars in their competition, each had a sous-vizzer who was selected for their expert data viz skills—JP King, Peter Jönsson and Kim Vitiello—who helped guide the finalists in the showdown.
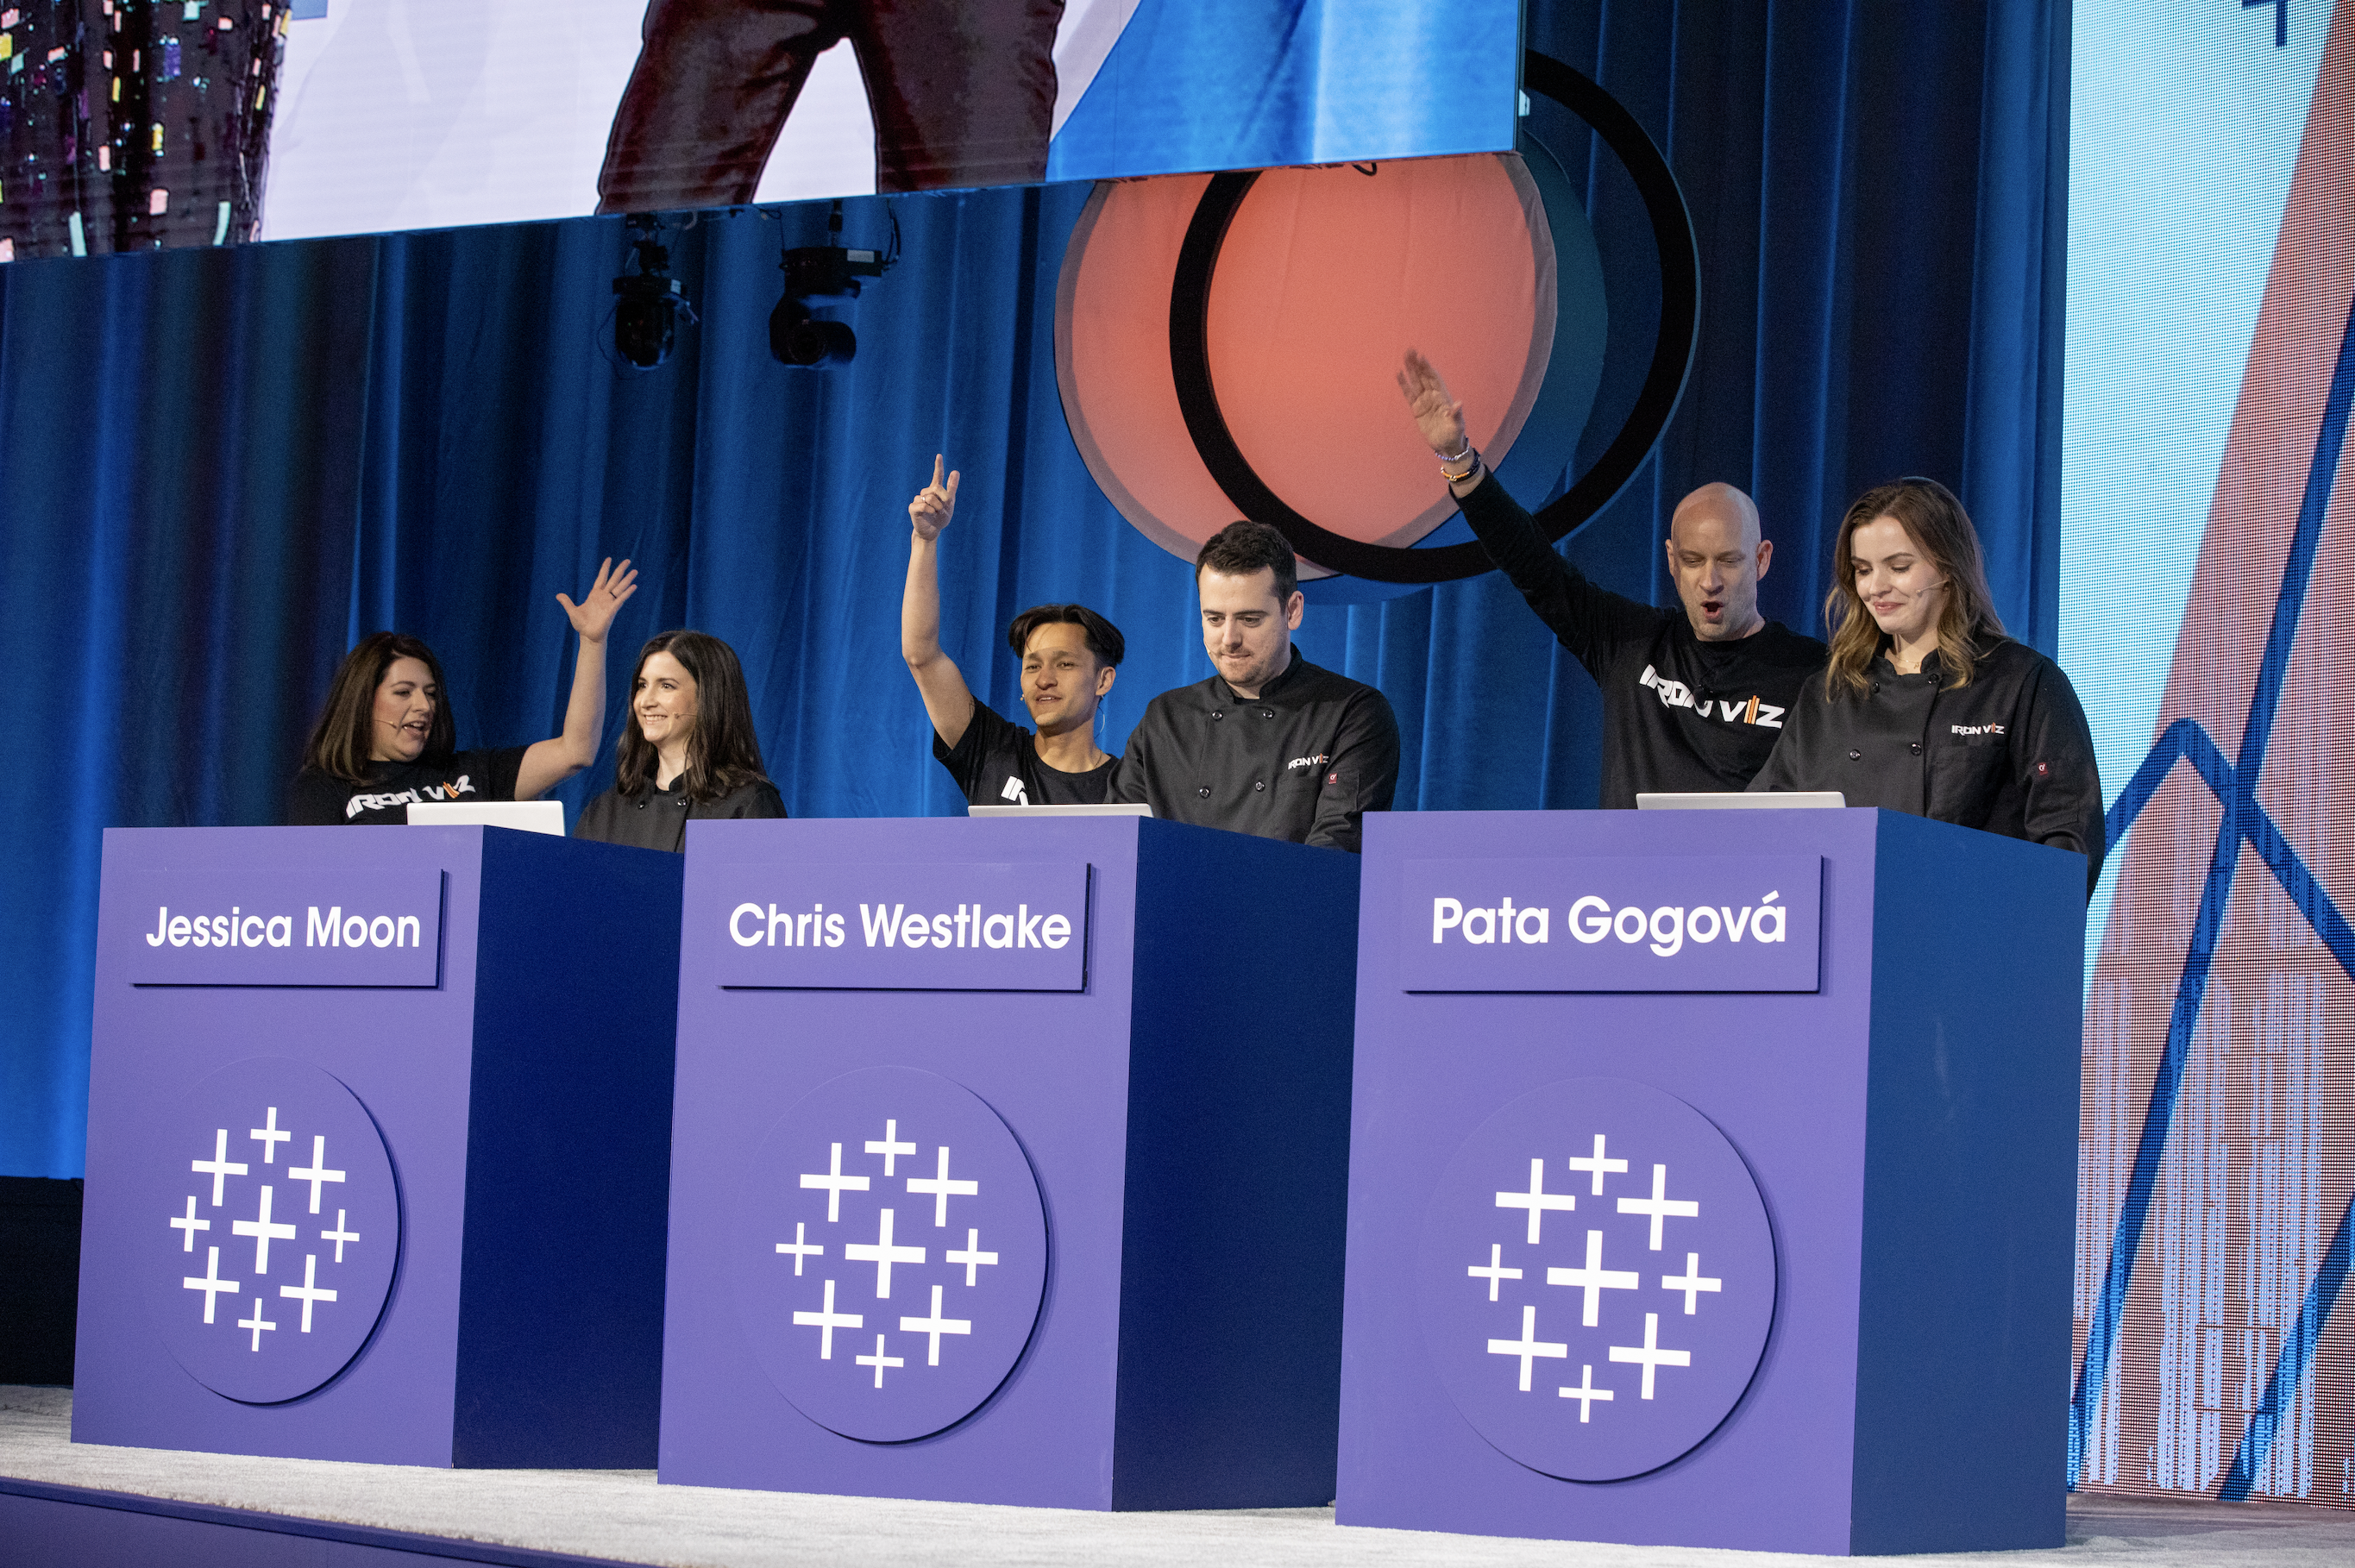
Finalists and sous-vizzers during the Iron Viz countdown clock, working on their visualizations. Left to right: Kim Vitiello, Jessica Moon, JP King, Chris Westlake, Peter Jönsson, and Pata Gogová.
The theme for this year's Iron Viz TV with a dataset of 61 million television episodes—powered by IMDb. The challenge for the finalists? To each build a visualization judged on three key criteria: design, analysis, and storytelling. The finalists must impress the panel of judges—reigning Iron Viz 2023 Champion Paul Ross, Director of Tableau Public Taha Ebrahimi, and making his judging debut, the veteran sous-vizzer, Principal Solution Engineer, Mark Bradbourne. With stakes this high, it was anyone's game.

2024 Iron Viz Judges (left to right) Paul Ross, Taha Embrahimi, and Mark Bradbourne.
The Iron Viz data vizzes
Let's dive into the dashboards created by each finalist and highlight key features that set them apart. Each visualization brought a unique perspective and story when analyzing the IMDb TV data.
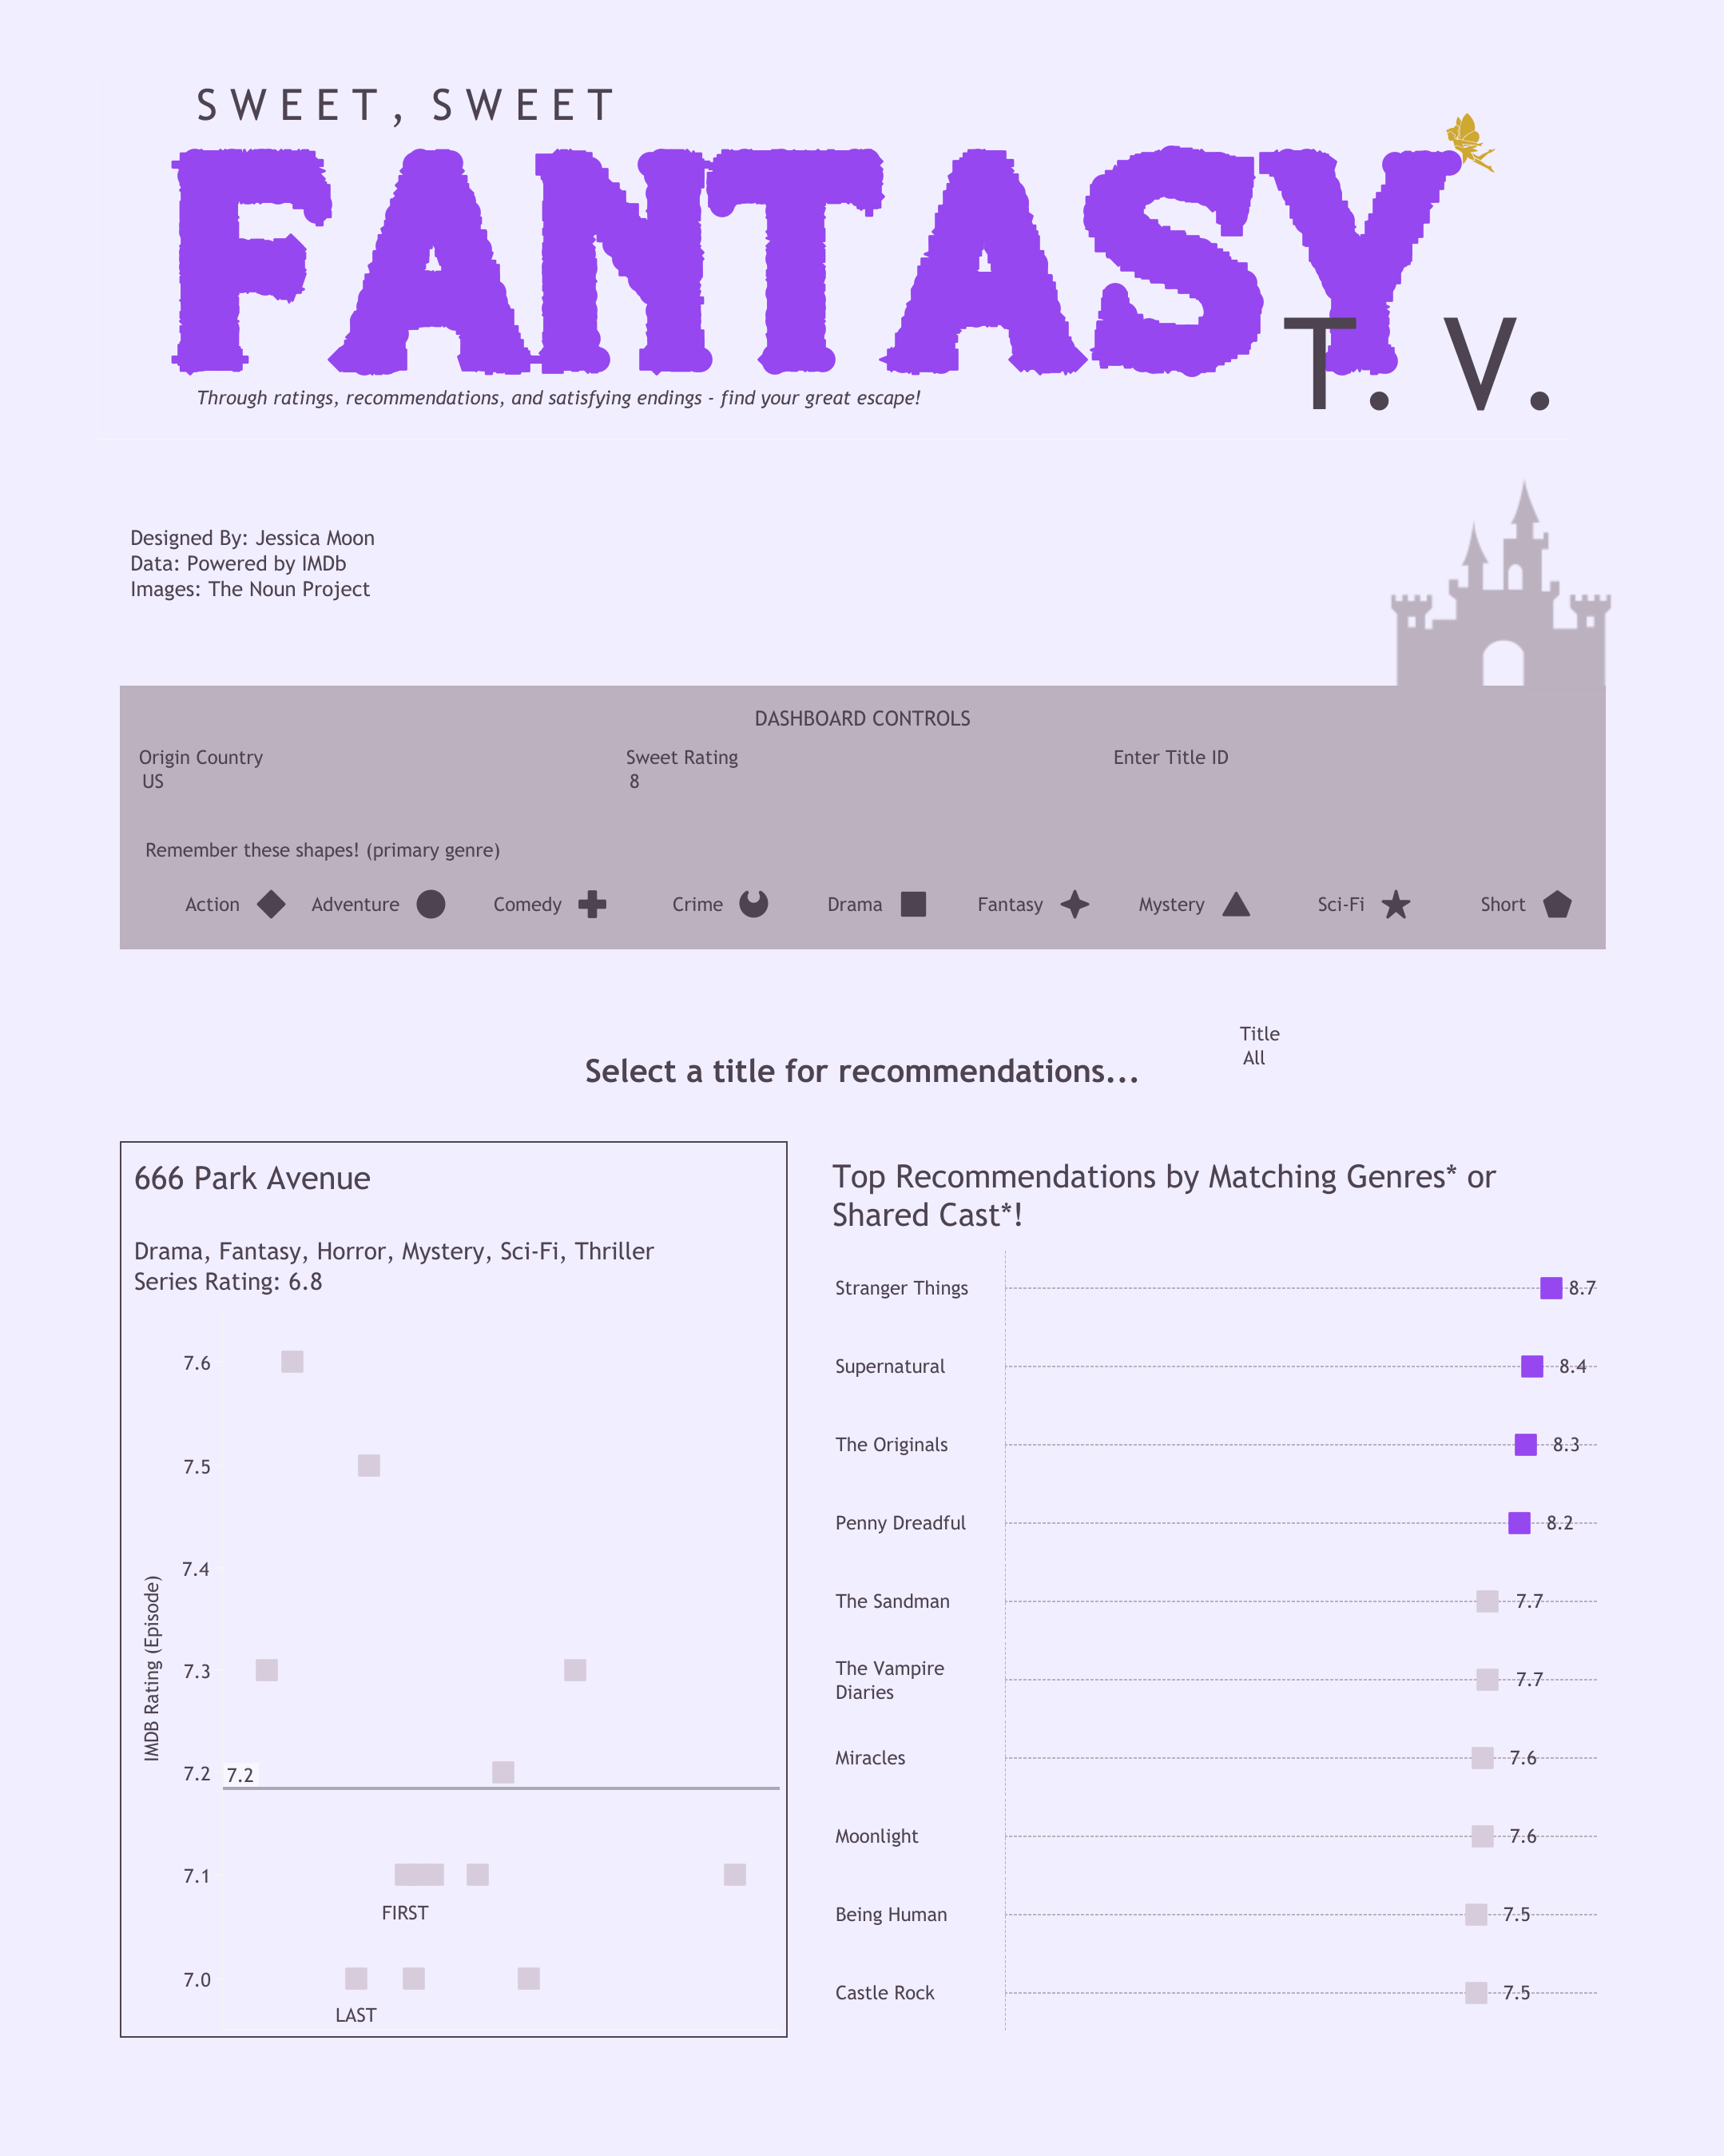
Fantasy TV by Jessica Moon
Inspired by the first fantasy series she ever watched with her family growing up, Buffy the Vampire Slayer, Jessica Moon’s visualization focused on all the series “that help us unwind and enter a new world of possibilities.” Along with her fantasy focus, Jessica helps you answer the age-old question, “what should I watch next?” with data.
Beginning with the context fairy in the top right corner, the viewer’s path is lit and clear. Jessica’s analysis looks at series with a start date of 1997 and above, with at least 1,000 IMDb votes, and “Fantasy” listed as one of the top 3 genres. With a simple yet effective pie chart to help viewers compare series’ IMDb ratings, Jessica helps us narrow down what to watch next. Following this, there's a deeper exploration into beloved fantasy shows, analyzing episode genres and ratings. Jessica's visualizations don't just recount data; they also recommend new series based on similarities in episode genres and casts, building upon your favorite shows. This approach provides a data-driven strategy for planning your next fantasy series binge, complete with top recommendations tailored to your tastes.
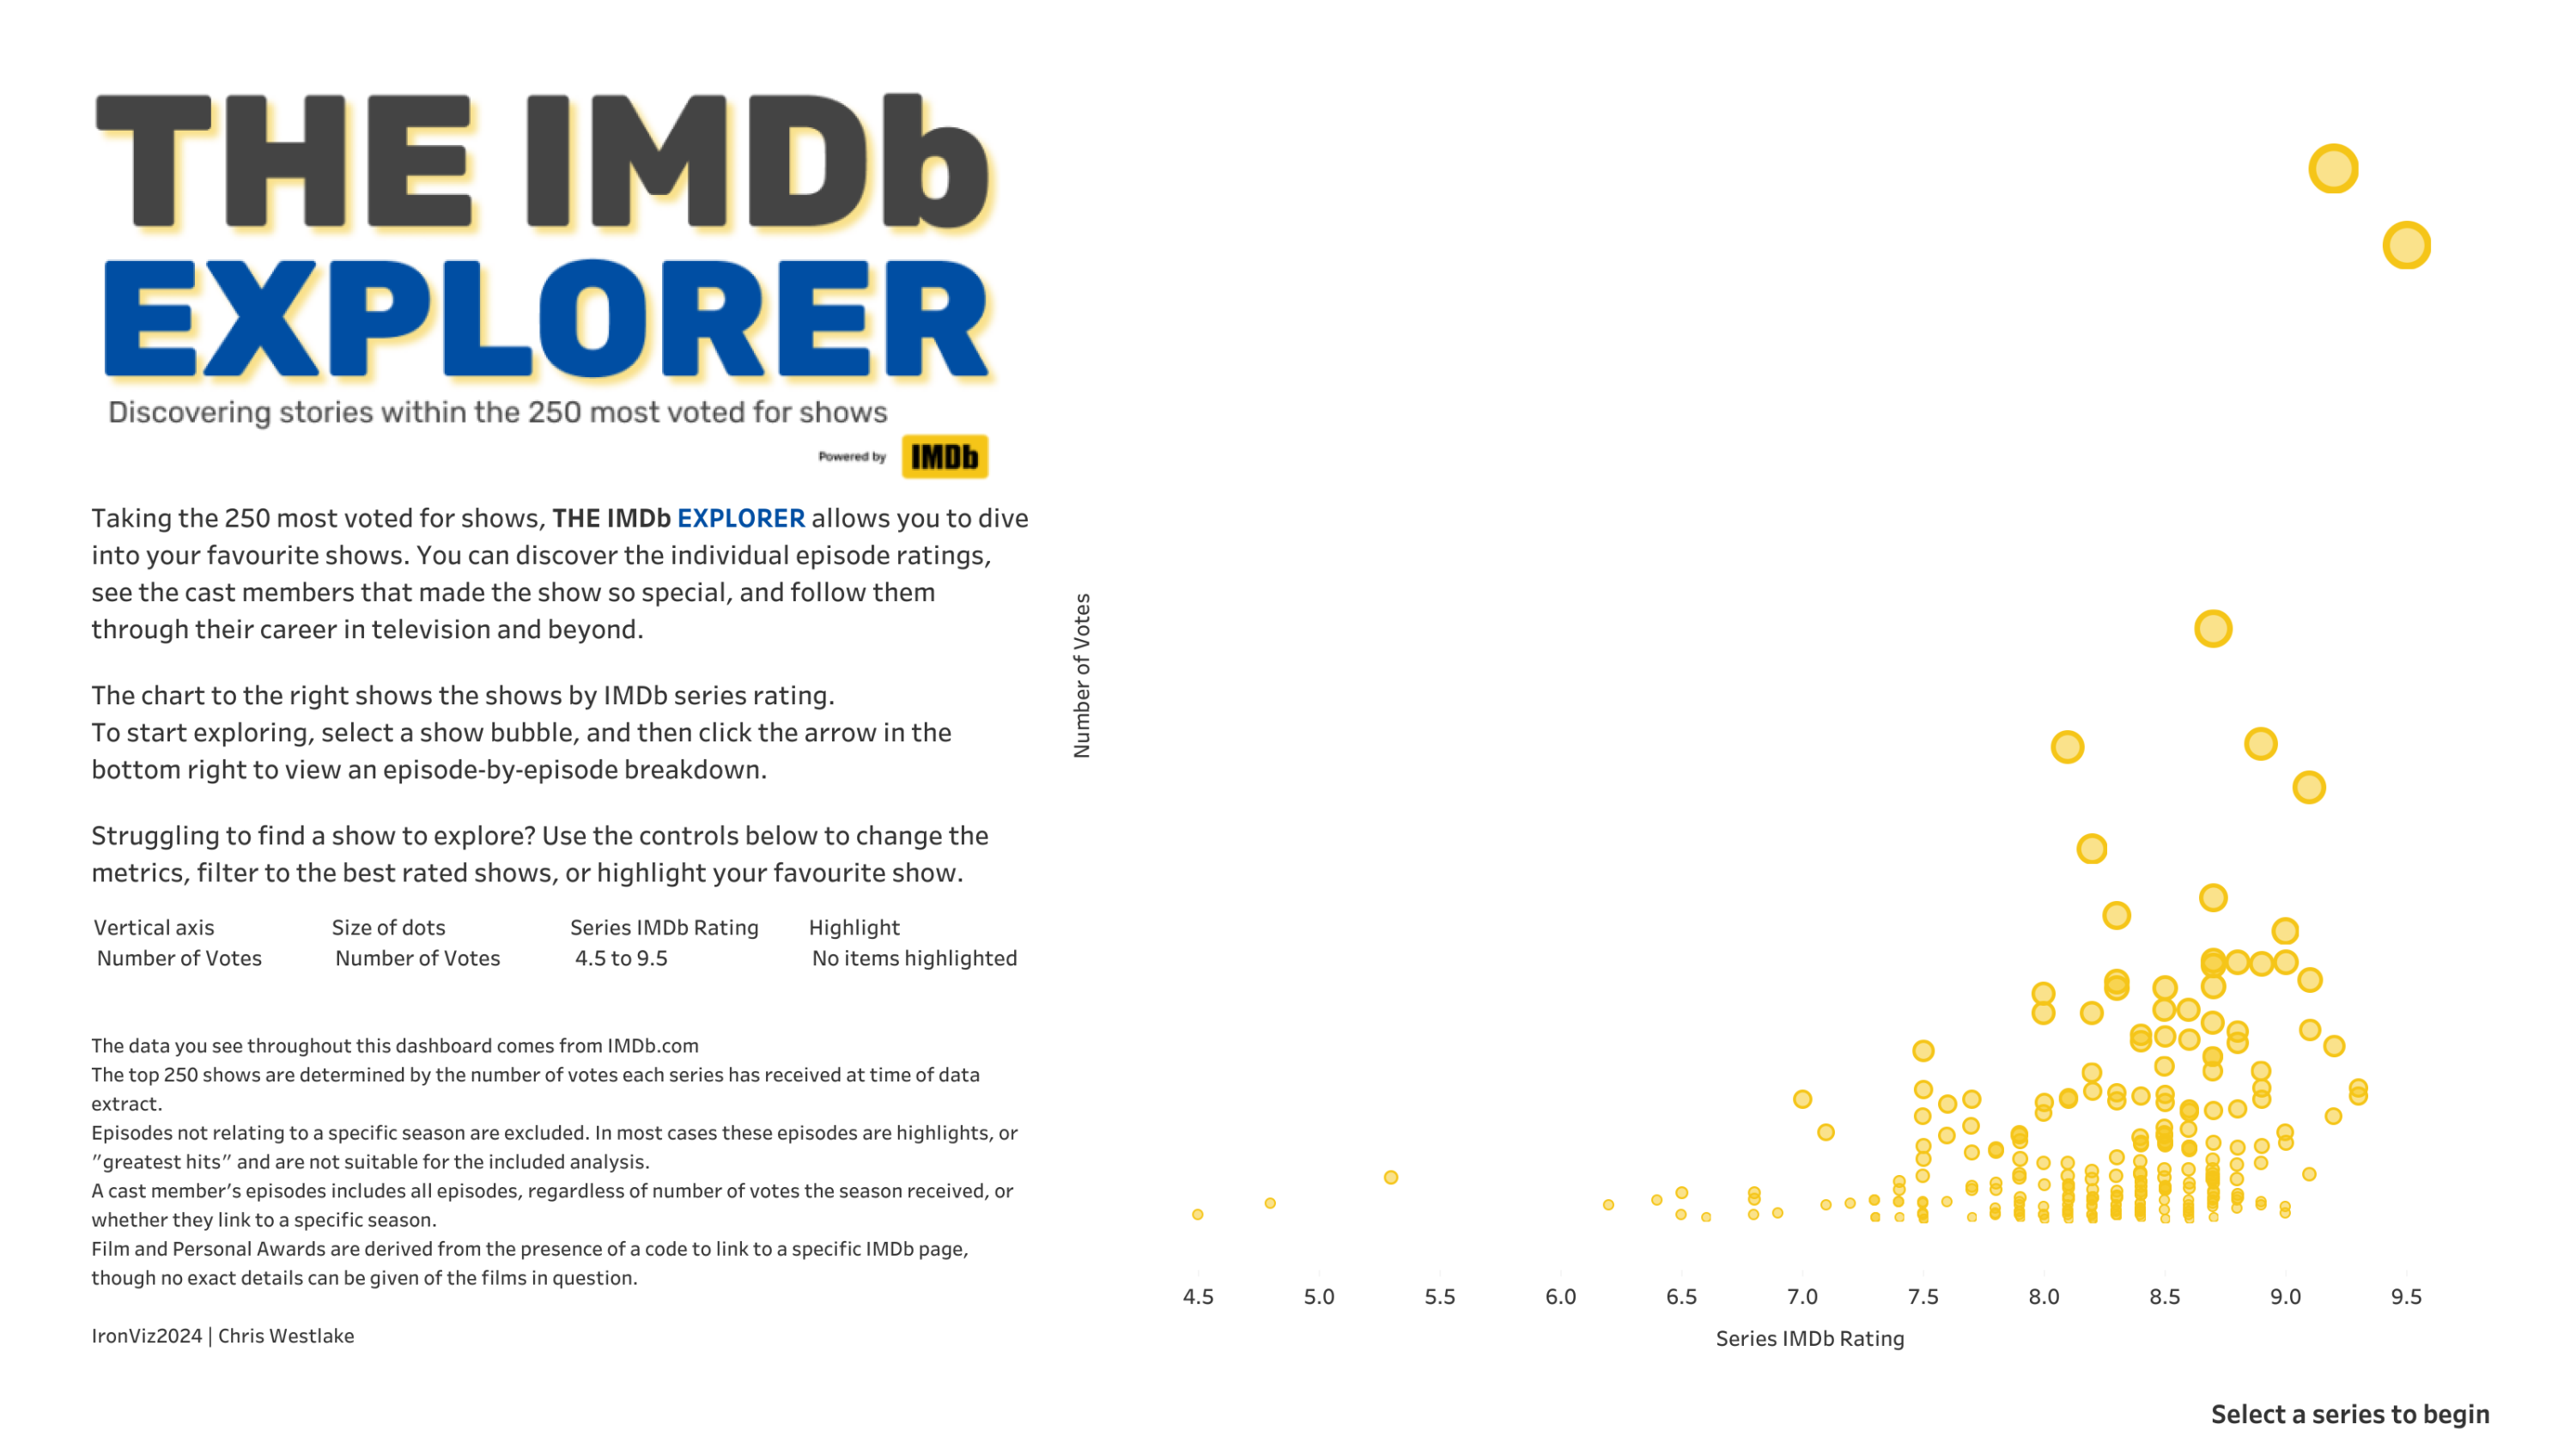
The IMDb Explorer by Chris Westlake
“Pick your own favorite TV show and go exploring” invites Chris Westlake, who’s analysis focuses IMDb’s 250 most voted for shows. His visualization allows you to discover individual episode ratings, learn about the cast members who have shaped our favorite series, and trace their career trajectories.
The adventure began with a dynamic chart that explores shows based on IMDb ratings. Chris showed how the viewer is in the driver's seat, with controls to adjust metrics, filter to the highest-rated shows, and spotlight personal favorites. Once a show is selected, the visualization dove deeper into its universe, examining the number of seasons, episodes, and their ratings. Chris highlighted outlier episodes—those that scored significantly above or below the average series and episode ratings—in red, making it easy to spot the most memorable moments. The exploration continued with a focus on the principal cast of each series, followed by an in-depth look at selected cast members' careers and accolades. One of Chris's standout features was his innovative use of map layers to create a radial scatter chart. Explaining his choice, Chris said, "having every episode on one horizontal line doesn't give you much space when you have more than a thousand episodes in a show and bending the axis gives everything a little bit more room." Chris's innovative design techniques and thorough TV data deep-dive made for an engaging data exploration.
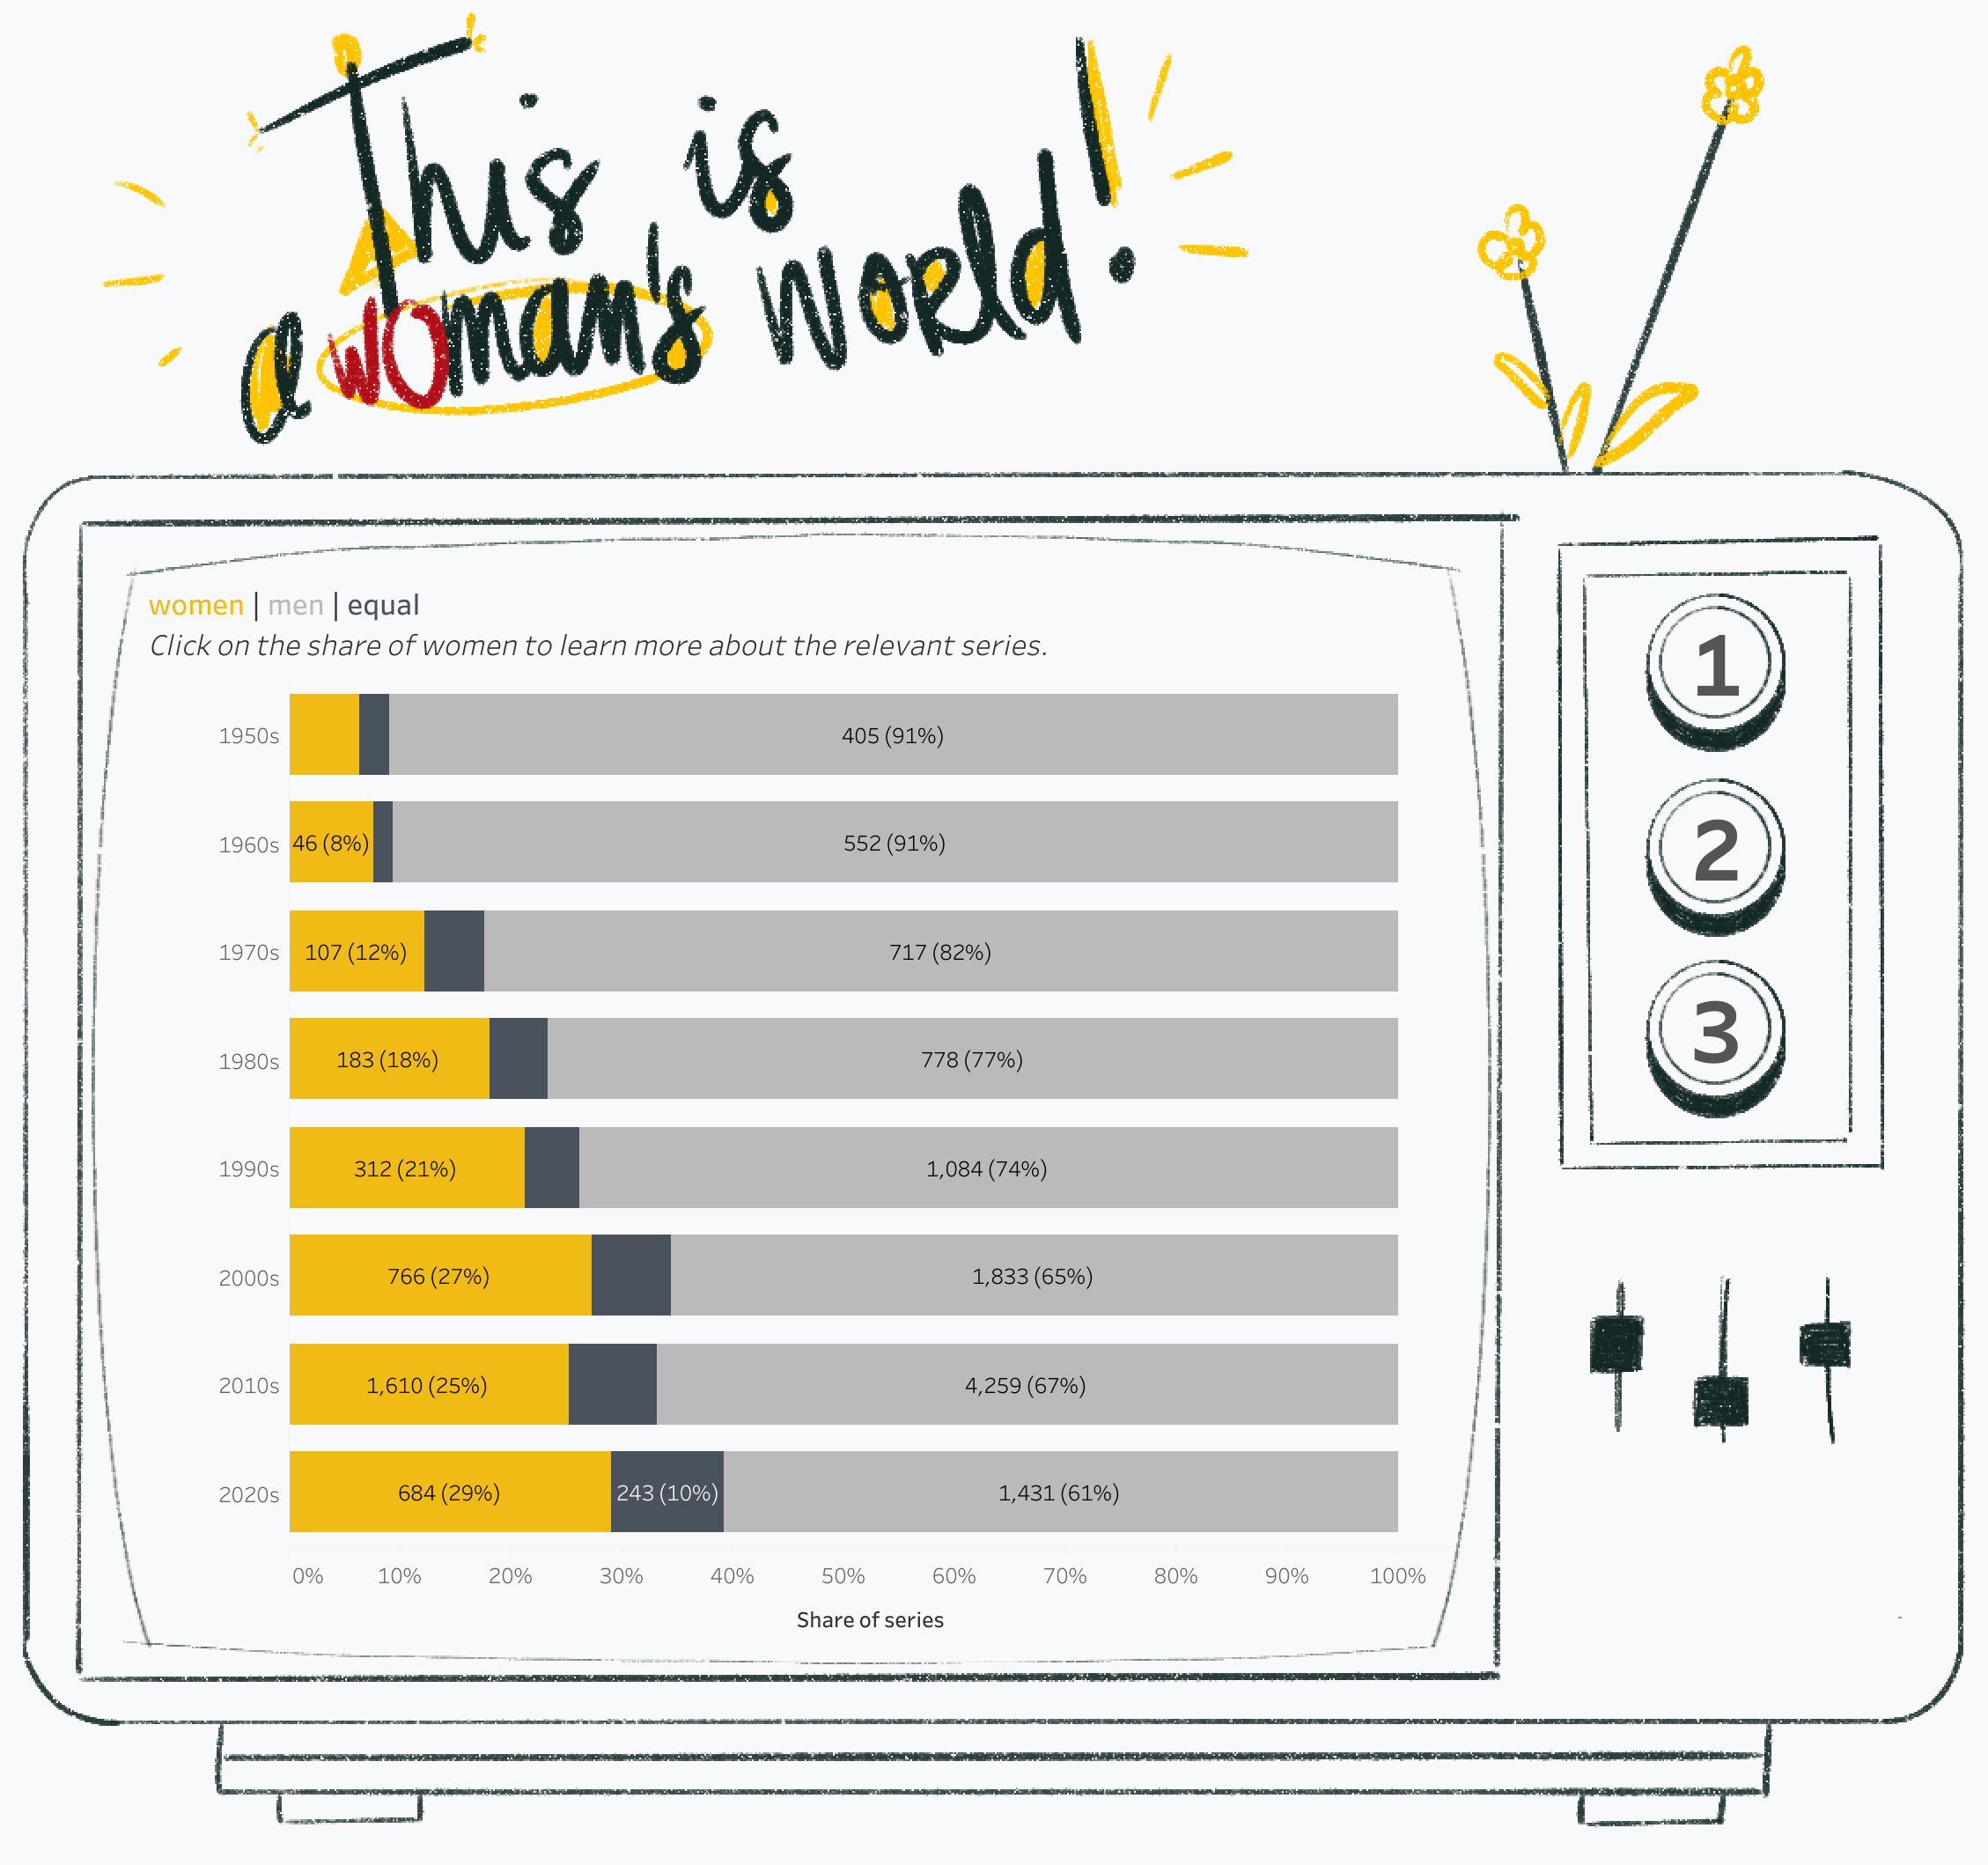
This is a woman's world! by Pata Gogová
Are we on the right track toward better representation of women in TV? Pata Gogová’s visualization helps us answer these questions by analyzing diversity trends across decades and TV genres.
From the start, Pata pulled viewers into the world of television through a hand-drawn TV frame, a hallmark of Pata's design style. The journey through the data began with stacked bar charts starting from the 1950s. Progressing through the decades, it is clear that representation for women in TV has been gradually increasing, with equal appearances of men and women growing from 3% in the 1950s to 10% in the 2020s. Focusing on interactivity, Pata incorporated old-school TV knobs as filter controls, which guided viewers through the data. The visualization then drilled down by decade, genre, and finally an exploratory list of shows based on those selections with 50% or more women appearances—making choosing a series that aligns with the representation you support easy. After a series selection is made, Pata included a URL action or play button, which connected you directly to the IMDb page of the show for a deeper exploration. Through this visualization, Pata empowers you to make informed and supportive choices in TV media.
And the 2024 Iron Viz Champion is Chris Westlake!
In a fierce competition that showcased awe-inspiring data storytelling, all three Iron Viz finalists delivered incredible performances. Each contestant brought a unique approach that captivated the audience. Ultimately, The IMDb Explorer by Chris Westlake surpassed the competition and was also crowned the "Fan Favorite" by the audience, aligning with the judges' choice. Congratulations to Chris Westlake and his chosen charity, Make a Wish Foundation.

Don’t want the excitement and mastery to end? Iron Viz is a chance for amazing vizzers who spend their days on Tableau Public to give the world a behind-the-scenes look at their magic. With over 3 million global profiles and 8 million vizzes available, there's a viz to explore for almost any topic.
Sign up to have a healthy dose of 'viz-spiration' delivered to your inbox with Viz of the Day. Also, stay tuned for Summer 2024 when the Iron Viz 2024 Championship dataset will be available for all the DataFam in Tableau’s Data + TV challenge.
Congratulations to everyone who shared visualization in the 2024 Qualifiers, and special congratulations to Chris, Jessica, and Pata on a viz-tastic showdown!
Storie correlate

DataFam Roundup: May 20–24, 2024
 24 Maggio, 2024

What can you learn from attending the Tableau Public User Group?
 21 Maggio, 2024

DataFam Roundup: May 13–17, 2024
17 Maggio, 2024
Subscribe to our blog
Ricevi via e-mail gli aggiornamenti di Tableau.