 Tableau Conference
Product Innovation from Devs on Stage at Tableau Conference 2025
 April 16, 2025
Check out all the new and upcoming product innovations shared by Tableau developers at TC25.
April 16, 2025
Check out all the new and upcoming product innovations shared by Tableau developers at TC25. Tableau Conference
Viz your Tableau Conference Schedule in 3 Steps
 April 13, 2025
Learn how to pull the TC schedule data and visualize it in Tableau by connecting to the data, configuring the relationships between TC sessions, schedules and speaker tables, and exploring the data to create visualizations.
April 13, 2025
Learn how to pull the TC schedule data and visualize it in Tableau by connecting to the data, configuring the relationships between TC sessions, schedules and speaker tables, and exploring the data to create visualizations.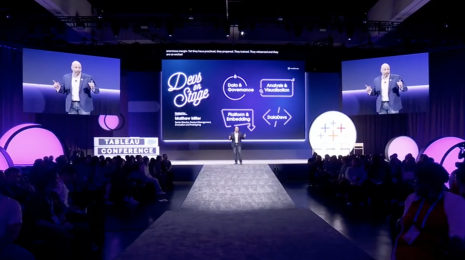 Tableau Conference
Product Innovations at Tableau Conference 2024
April 30, 2024
All the highlights and product innovations announced at Tableau Conference including Devs on Stage.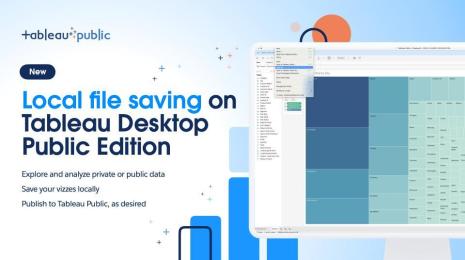 Tableau Public
Local File Save with Tableau Desktop Public Edition
 April 30, 2024
Local file saving is available for all Tableau Desktop Public Edition users for free.
April 30, 2024
Local file saving is available for all Tableau Desktop Public Edition users for free. Tableau Public
The Tableau Public Viz Gallery at Tableau Conference 2024
 April 29, 2024
Explore the 2024 Viz Gallery featuring 31 captivating vizzes from global creators.
April 29, 2024
Explore the 2024 Viz Gallery featuring 31 captivating vizzes from global creators. Tableau Conference
Tableau Conference ‘Call for Participation’: Tips for Submitting Your Session Proposal
3 tips to submitting a compelling Tableau Conference session proposal.
 Iron Viz
Top 10 Qualifiers for Iron Viz 2024
 January 17, 2024
Learn about the top 10 visualizations, finalists, and judging for the Iron Viz 2024 championship—Tableau’s annual data visualization competition.
January 17, 2024
Learn about the top 10 visualizations, finalists, and judging for the Iron Viz 2024 championship—Tableau’s annual data visualization competition. Iron Viz
What is Tableau’s Iron Viz?
 September 26, 2023
Learn more about the world’s largest data visualization competition—Tableau’s Iron Viz.
September 26, 2023
Learn more about the world’s largest data visualization competition—Tableau’s Iron Viz. Tableau Conference
A New Day for Data—Product Innovations from Tableau Conference 2023
 May 9, 2023
Discover upcoming product innovations featured in the opening keynote of Tableau Conference.
May 9, 2023
Discover upcoming product innovations featured in the opening keynote of Tableau Conference. Product
Power your analytics advantage—new product innovations from Tableau Conference 2022
Learn more about Tableau product innovations including Tableau Cloud, Data Stories, Model Builder, Scenario Planner, and more. Tableau Conference
Staff picks for Tableau Conference 2022 sessions
Make the most of Tableau Conference with these staff recommendations for must-see sessions at TC22. (Then check out the complete session catalog—it’s off the charts!) Tableau Conference
Top moments from Tableau Conference 2021
Read highlights from the Tableau Conference including product vision, customer stories, as well as Tableau’s pledge to train 10 million data people.
Subscribe to our blog
Get the latest Tableau updates in your inbox.