Visualizing Women's Impact to History Through Data Visualization


Every March, we celebrate women who have educated us, inspired us, led us, and significantly impacted the direction of society during Women's History Month. In the age of data-driven insights, it's fitting to explore how data visualization can be a powerful tool in telling the stories of women's achievements, struggles, and progress.
Explore this selection of data visualization from the Tableau Community to learn something new, interact with women-focused data, and spot patterns, trends, and outliers. Don’t forget to star your favorites and follow these authors on Tableau Public.
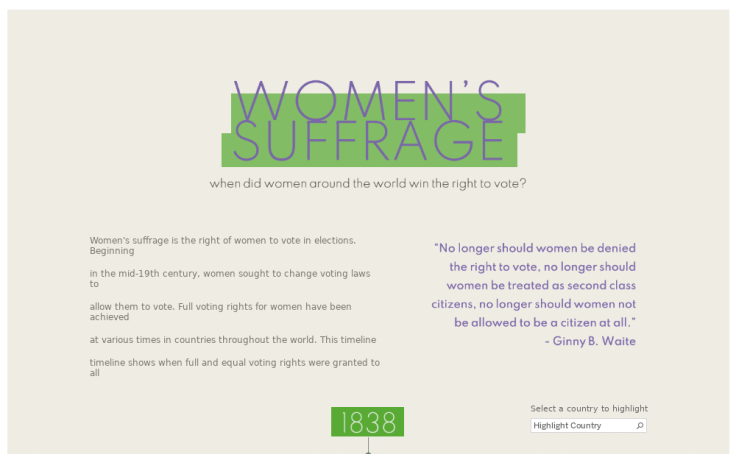
Women's Suffrage | #WomensHistoryMonth
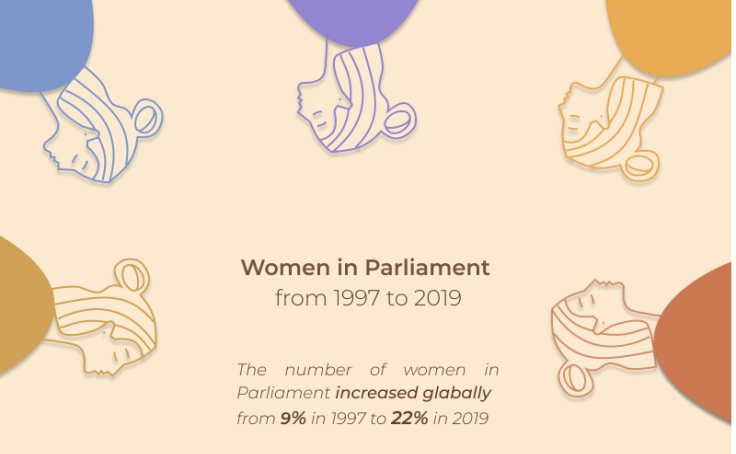
Women in Parliament
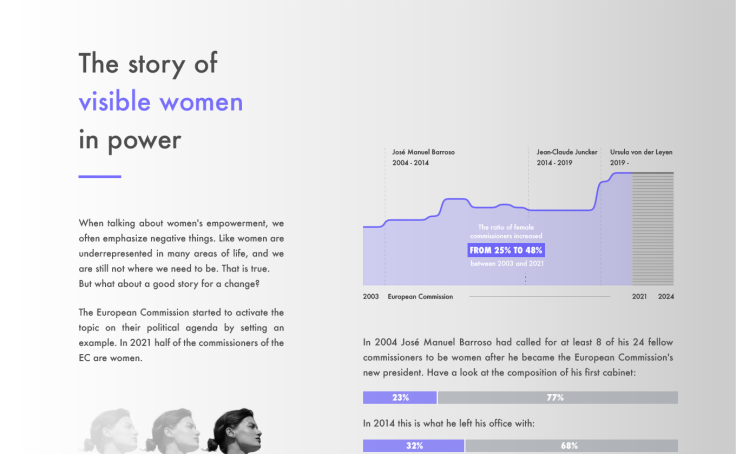
Visible Women
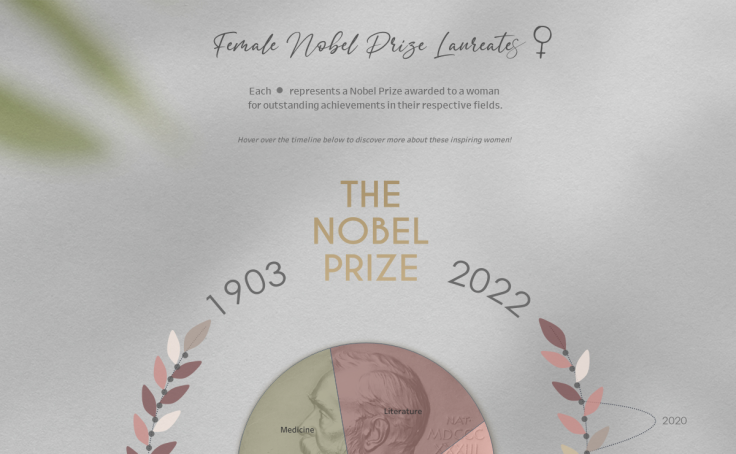
Female Nobel Prize Laureates | Back 2 Viz Basics
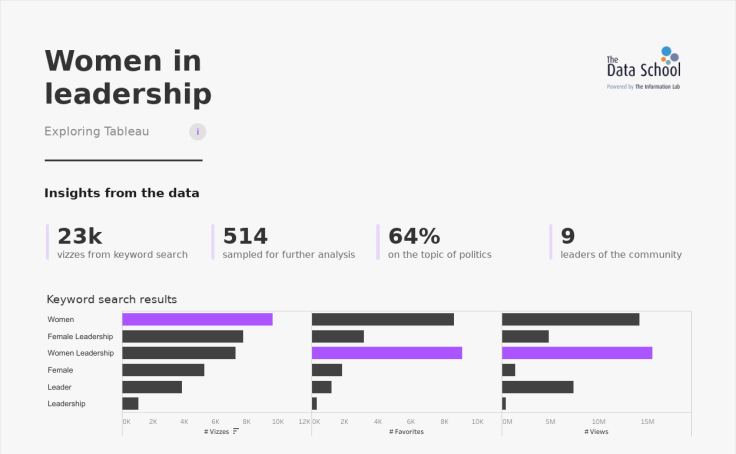
Women in leadership
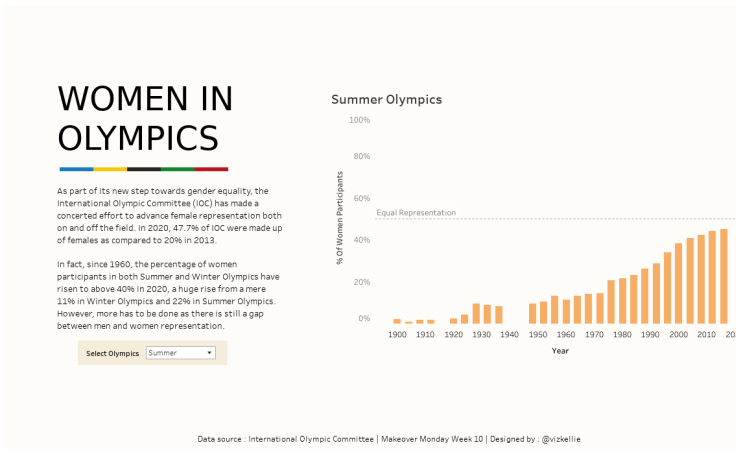
Women in Olympics
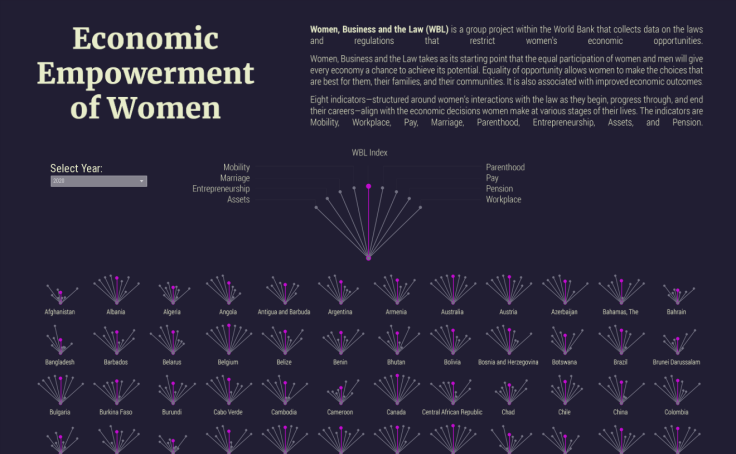
Women, business, and the law
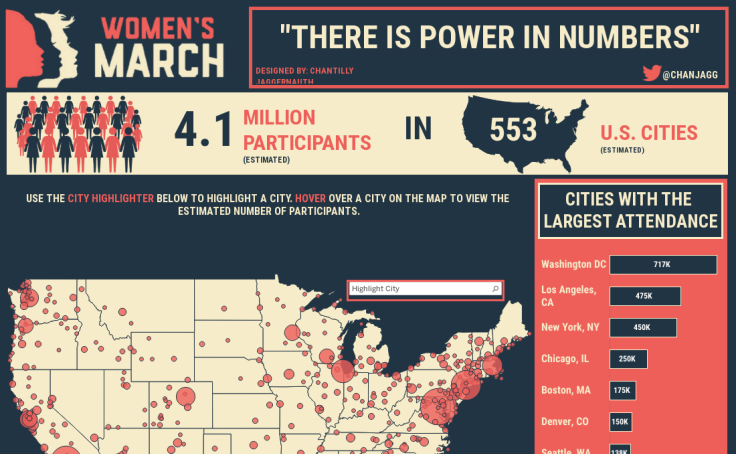
Women's March - There is Power in Numbers
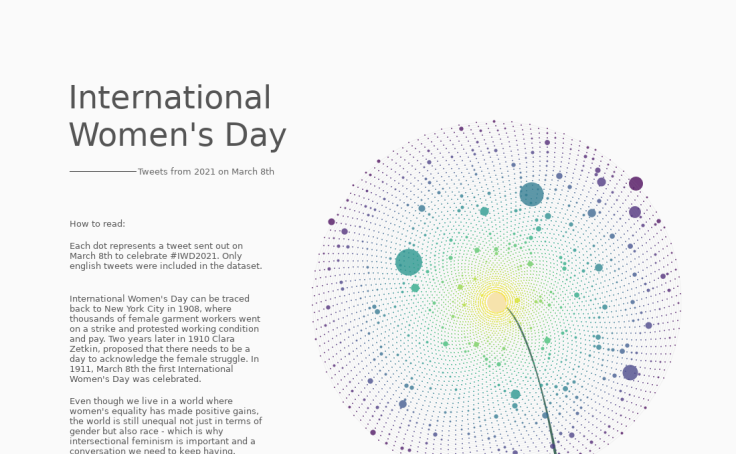
International Women's Day
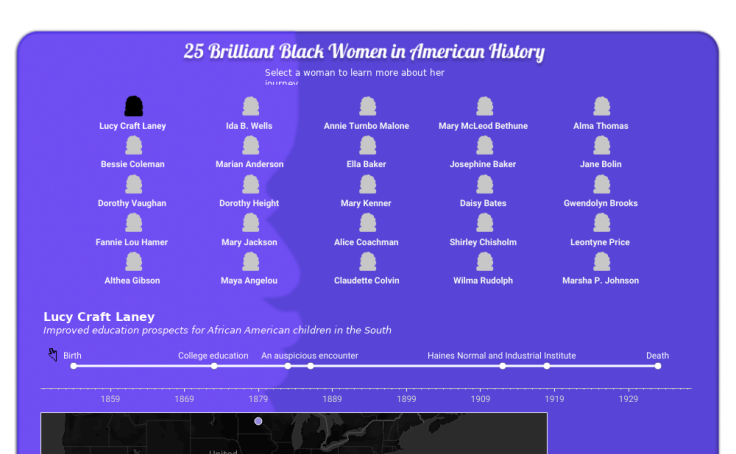
Brilliant Black Women in American History

Women in STEM
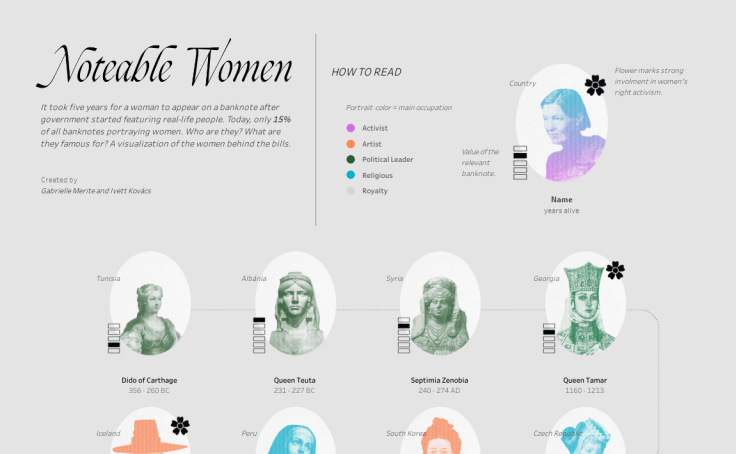
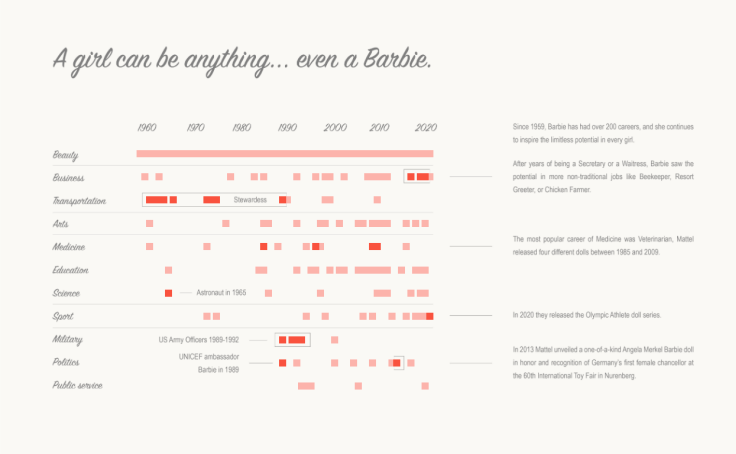
Noteable Women
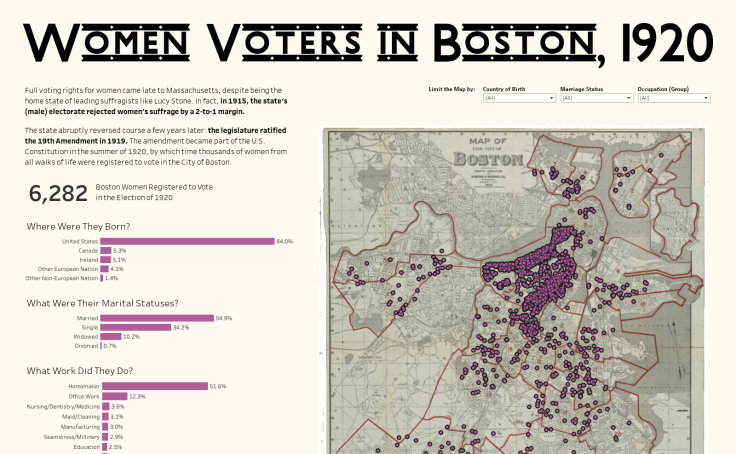
Boston Women Voters
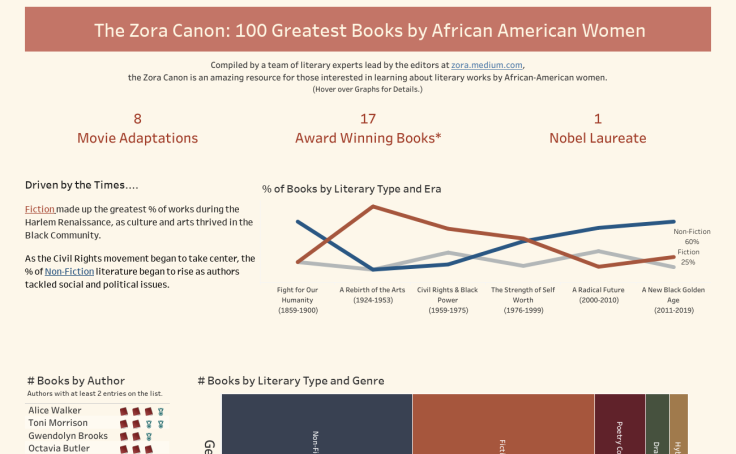
100 Greatest Books by African American Women

Stellar love celebrating women who reach for the stars
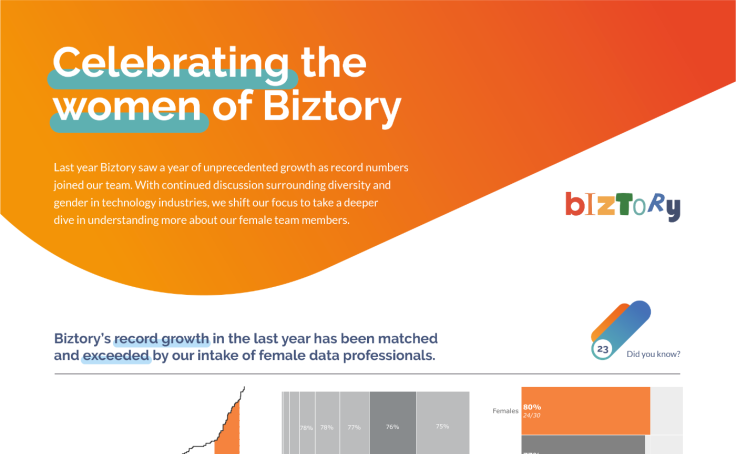
Celebrating the Women of Biztory
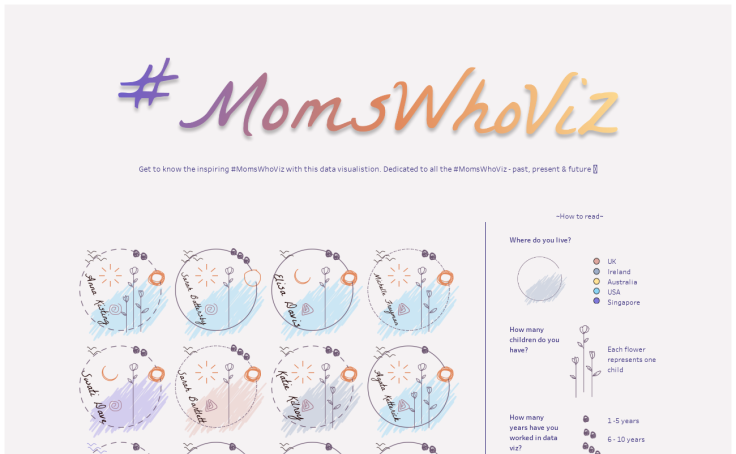
#MomsWhoViz | #WomensHistoryMonth

Women in Business and Climate Change
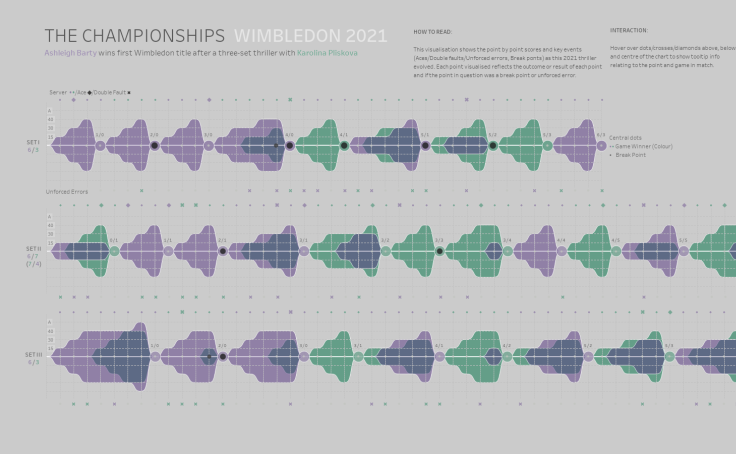
Wimbledon 2021 AB vs KP
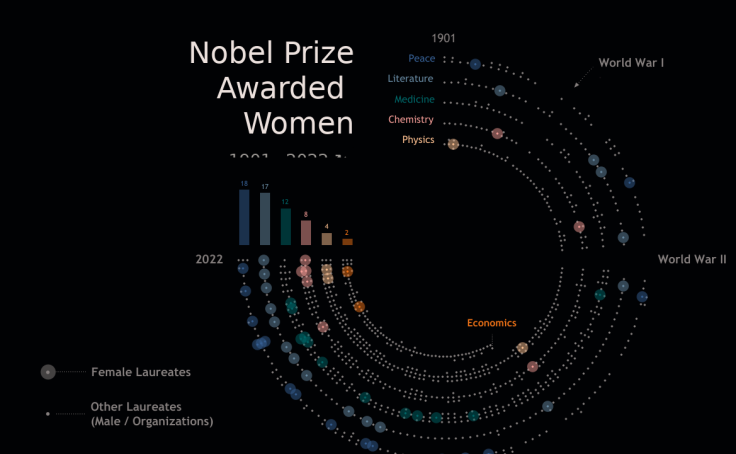
Nobel Prize Awarded Women #B2VB
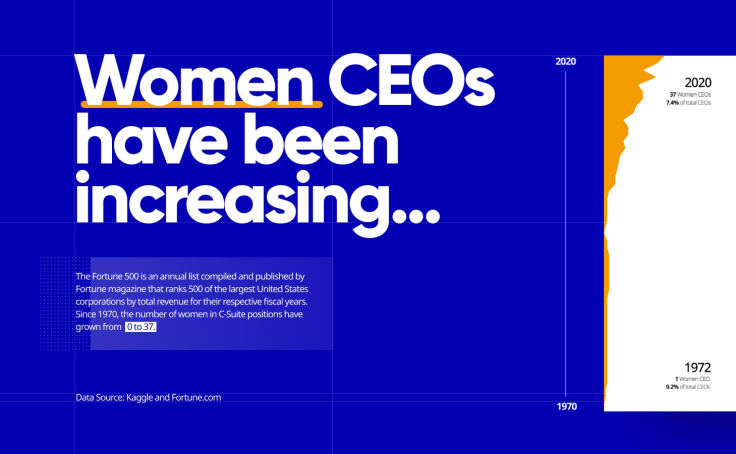
Diversity in Data: Women CEOs
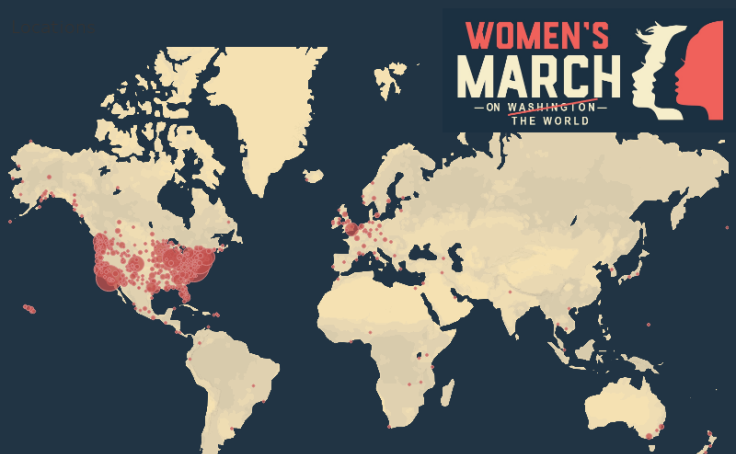
Women's March on the World
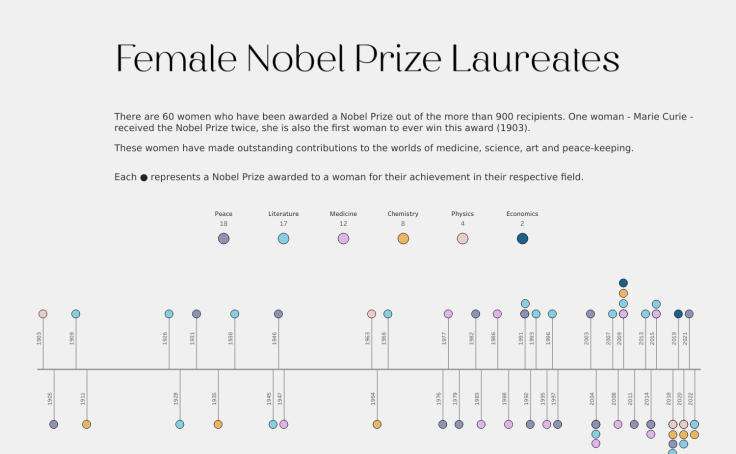
Female Nobel Prize Laureates
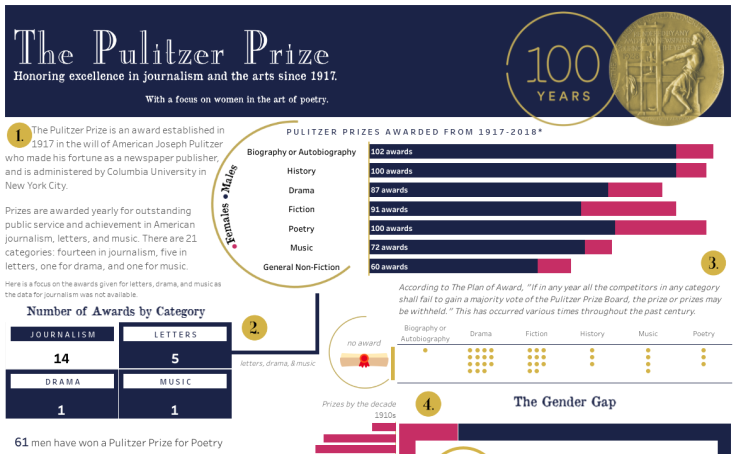
Pulitzer Prize Winners - Women in Poetry
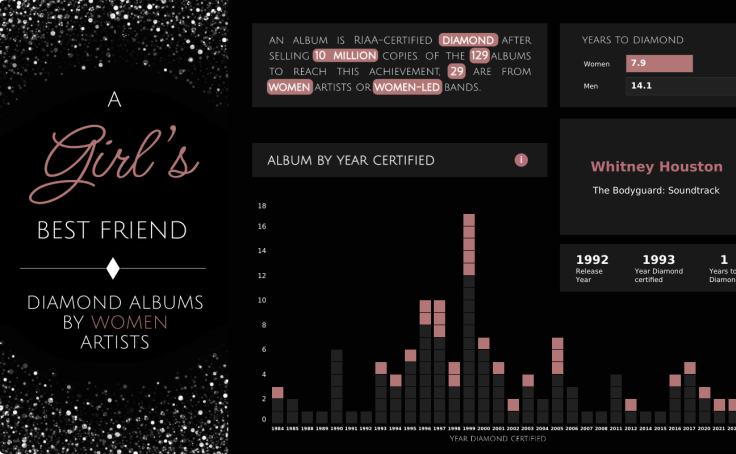
A Girl's Best Friend - Diamond Albums By Women Artists
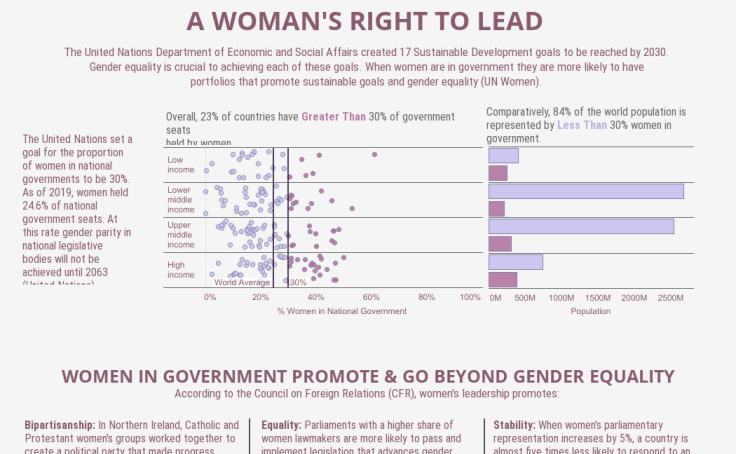
Women in Government Worldwide
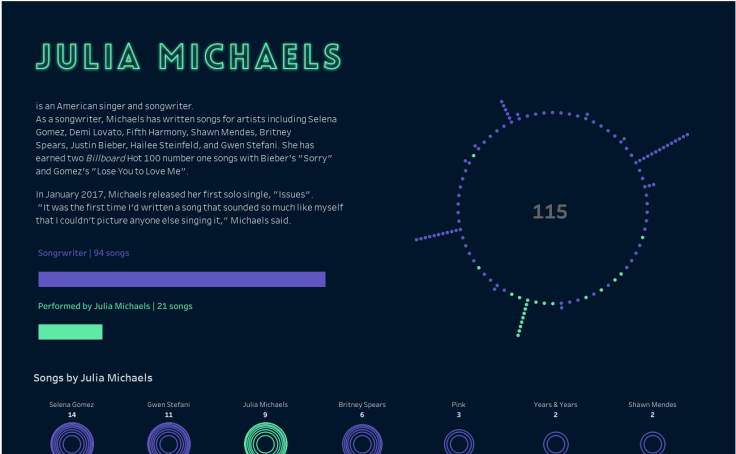
Julia Michaels | Singer & Songwriter

The Matilda Effect | #WomensHistoryMonth
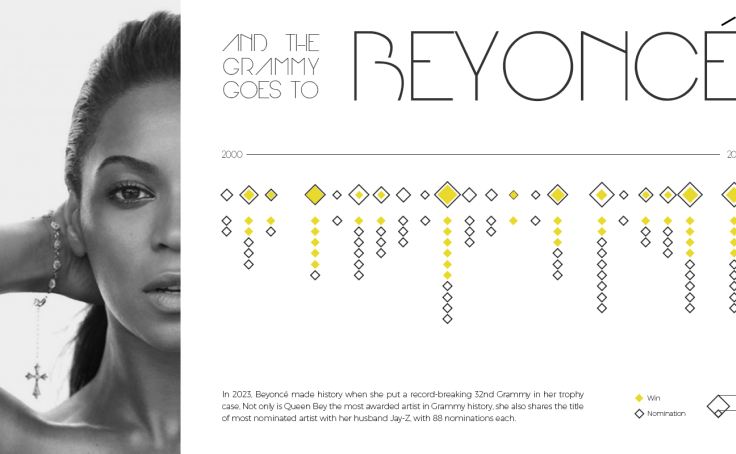
Beyoncé's Grammys
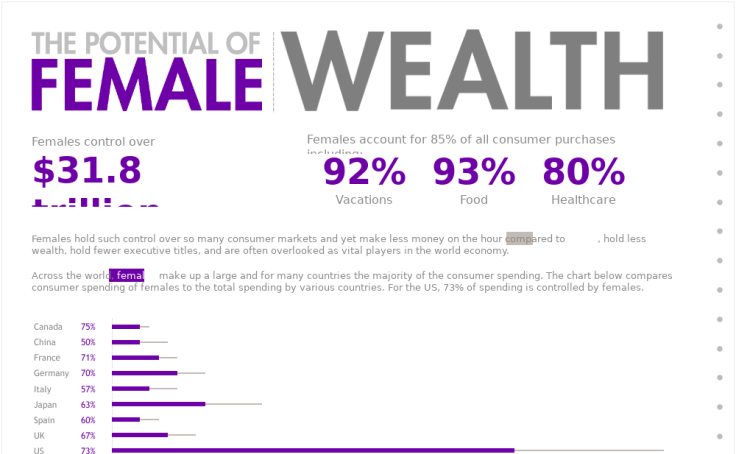
The Potential of Female Wealth

On top of the World | #WomensHistoryMonth


Aviation Needs More Women Involved
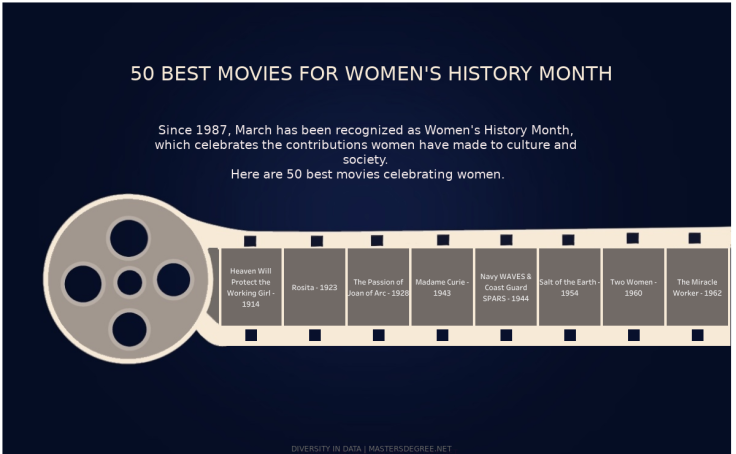
50 BEST MOVIES FOR WOMEN'S HISTORY MONTH
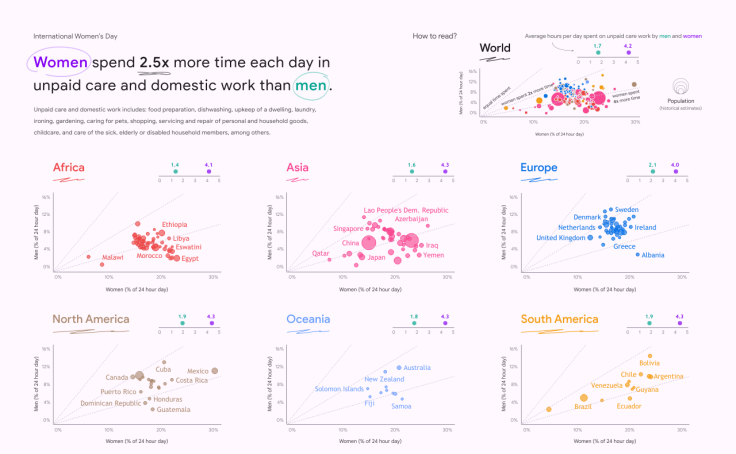
International Women's Day
Want to go beyond just exploring vizzes about the topic? Consider joining a Tableau Community Project and vizzing alongside others. Participating is great way to recieve feedback and practice your data skills.
For example, this month's Iron Quest theme is women. "Your viz can focus on any aspect of the theme that you wish. You might choose to viz about inspirational women in entertainment, sports, business, inspiring writers, or even notable women from history. You could also visualize social issues that impact women such as the gender pay gap, healthcare, or female representation in politics." Get all the details and learn how to participate.
As we celebrate Women's History Month, let us embrace the power of data visualization to tell the stories of women's triumphs, challenges, and ongoing efforts toward equality. By harnessing the potential of visual representation, we can honor the past and advocate for a more inclusive and equitable future. Let the data speak, and let us all be inspired to contribute to a world where women's history is not just celebrated in March but recognized and valued every day.
Related Stories

DataFam Roundup: February 24-28, 2025

DataFam Roundup: February 17-21, 2025

DataFam Roundup: February 10-14, 2025
Subscribe to our blog
Get the latest Tableau updates in your inbox.