Shaping 2024 with Data: A Year of Data Visualizations on Tableau Public


As we reflect on 2024, data has remained a powerful tool for connection, insight, and action. Data brings us together and helps us navigate complex challenges, spark innovation, and foster understanding. Tableau Public was filled with vibrant, impactful data visualizations from data storytellers, analysts, and enthusiasts from around the world.
Throughout the year, there were over a million vizzes published to Tableau Public. The DataFam turned raw data into insights, utilizing a variety of chart types—from maps to scatter plots, bar charts, and more. The Tableau Community took this a step further through Tableau Community Projects, fostering collaboration, creativity, and learning. Together, they used their talents not only to create impactful visualizations but also to inspire and support one another throughout their data journeys.
A Year of Data Visualizations
This year, the DataFam explored a wide range of topics that impacted society, economics, and the environment. From the Paris 2024 Olympics and major sports events to business dashboards across industries, stock markets, global summits on education and the environment, and delved into entertainment trends like the Oscars and exploring #DataPlusMovies and #DataPlusTV in collaboration with IMDb. Explore a curated collection of inspiring data visualizations and the 24 most popular vizzes created on Tableau Public in 2024.
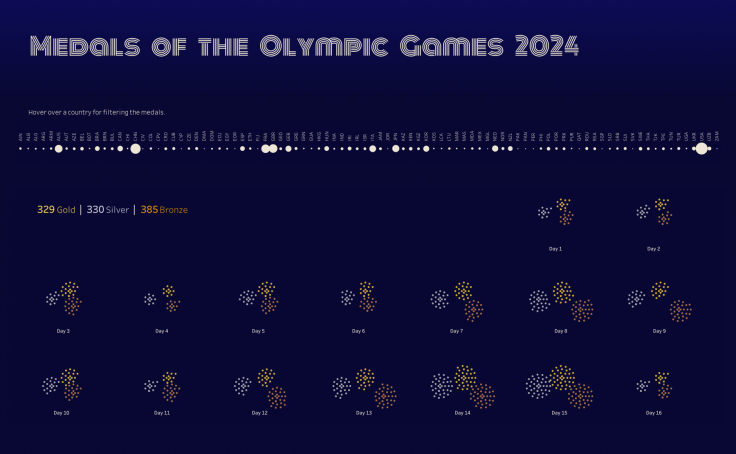
Medals of the 2024 Olympics

From Scotland with love | My 150th Viz on Tableau Public

Lighting the Flame for Change
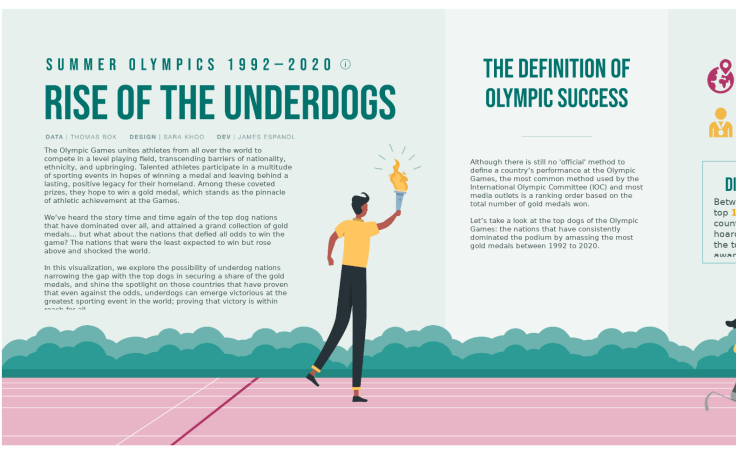
Rise of the Underdogs

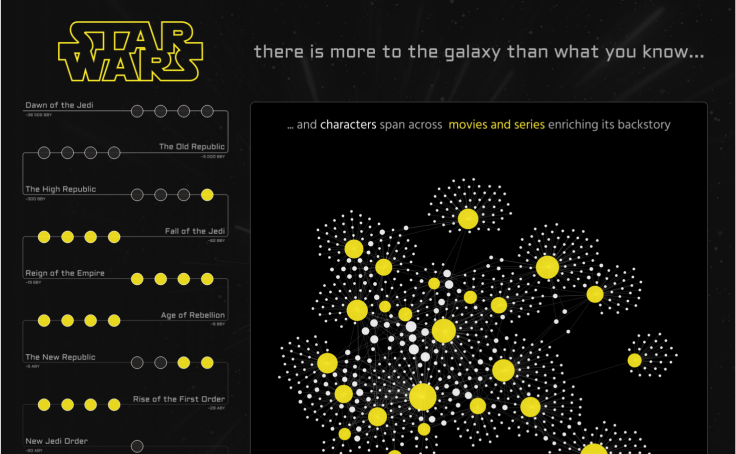
The character network of Star Wars
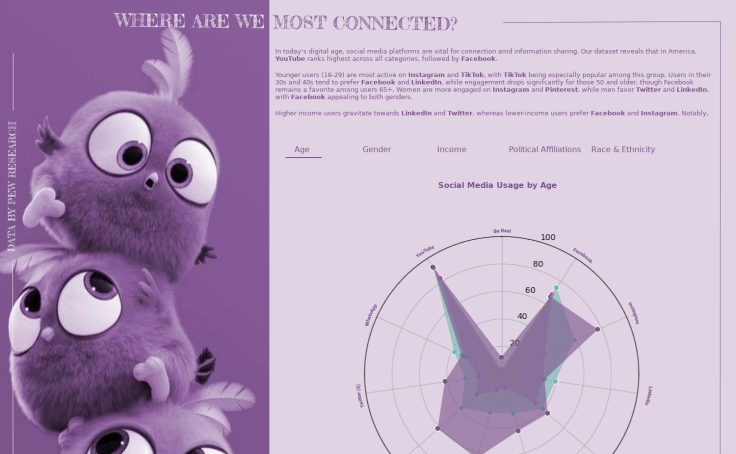
Social Media Usage
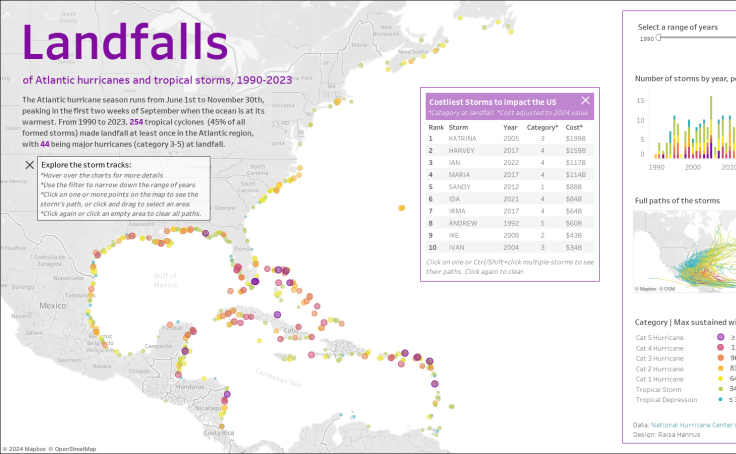
Atlantic Hurricanes 1990-2023
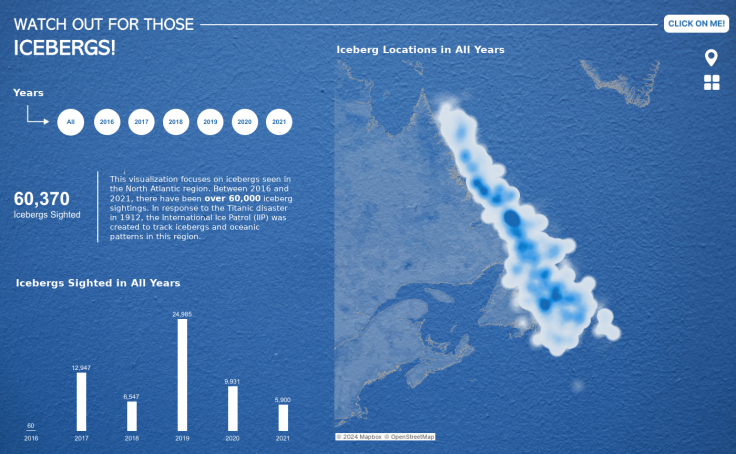
Iceberg Sightings

Breast Cancer Analysis 2024-25 Dashboard

USA & The Summer Games

Nigerian Heads of State Since Independence

Counting New York's Pigeons

World Literacy Rate

American Horror Story | The Ever Evolving Cast

30 Days of Nature in Bansko

Oahu Peaks


Iris Chromatics | Worldwide Eye Color Map

#MakeoverMonday wk 19 - Global Energy Consumption


Hosts of The Gay Games

2023 (Taylor's Version)

The Dead Heat

Tyson vs Paul

Explore Mount Gede (2,958 masl)

Love Is All Around #DiversityInData


The English Whisky Map


Oscar Nominations 2024

Submissions for Noise Solution | Viz For Social Good

Foodie Finds in Bengaluru

TV's Sci-Fi DataVerse

Avatar: The Last Airbender | #DataPlusTV

Heptathlon Paris Olympics 2024

Bluey

Datafrik Hotel Dashboard

New Year's Resolutions 2024

MLB Salaries | B2VB 2024 w1

Online Store Sales Dashboard 2024

Mamma Mia - Thank you for the Music

NBA Scorigami

Death from Natural Disasters

8 Ways to Visualize Progress Bars in Tableau with Steps

Business Dashboard: Car Rental Performance

Performance Dashboard #B2VB

ABC Shipping Logistics

England Men's Team Squad Stats
Most Favorited Vizzes of the Year
Take a look back at the twenty-four most-popular vizzes published and favorited on Tableau Public in 2024.

16 Different Ideas to Visualize your KPIs

Supermarket Analysis

Time Series Analyse

Tableau Tables

Udemy Course Analysis Dashboard


Call Center Dashboard | RWFD

Golf Superstore Performance

Superstore Profit Analysis

Data Visualisation Catalogue Part2

Custom Drop Down Menus

How common is your birthday?


London in Numbers

Superstore Overview Dashboard

KPI Cards Visual

Human Resources Dashboard, 2000 - 2020 | #RWFD

HR Attrition Dashboard


Marketing Campaign Performance Dashboard

Web Traffic Dashboard

Tables Rules and Tips

Tableau Circular Charts Catalogue
Related Stories

Meet 2025 Iron Viz Finalist Bo McCready
 April 8, 2025

Meet 2025 Iron Viz Finalist Kathryn McCrindle
April 6, 2025

Meet 2025 Iron Viz Finalist Ryan Soares
April 3, 2025
Subscribe to our blog
Get the latest Tableau updates in your inbox.