Todas as histórias de
 Google
Conecte-se diretamente ao Planilhas Google no Tableau 10
Seus dados estão no Planilhas Google? No Tableau 10, você pode se conectar diretamente a eles! Visualizations
Cinco dicas para criar visualizações adaptadas para daltônicos
Este é o primeiro de uma série de artigos sobre algumas das conhecidas “regras de visualização de dados”. Frequentemente ouvimos sobre essas regras, mas muitas vezes os detalhes por trás delas não são explicados em profundidade ou são completamente ignorados. Gostaria de examinar algumas delas para entender melhor como aplicá-las. Para a primeira parte da série, analisei o problema de usar as cores verde e vermelho juntas.
 Tableau Cloud
Tableau Cloud tips: Extracts, live connections, & cloud data
 14 Abril, 2016
In this post, we’ll dive into the difference between data extracts and live connections, and when to use them. We’ll also look at publishing data sources to Tableau Online.
 Snowflake
Introducing the Snowflake connector in Tableau 9.3
Now in Tableau 9.3, you can connect to your Snowflake Elastic Data Warehouse and pick which virtual warehouse you want to use.
 Visualizations
6 tips to make your dashboards more performant
 15 Janeiro, 2016
We here at Tableau are very proud of how easy it is to see and understand data with Tableau. Once you get started, it’s intuitive to dive deeper by adding more and more fields, formulae, and calculations to a simple visualization—until it becomes slower and slower to render. In a world where two-second response times can lose an audience, performance is crucial. Here are some tips on making your dashboards more performant.
 Visualizations
Format This Interactive Key-Metrics Dashboard in Just 10 Minutes
Want more of your colleagues to dive into data? Introduce them to the data-informed way of life with an elegant dashboard about key metrics. A high-level dashboard that keeps the company updated at all levels and also drills down in seconds can help people evolve from passive consumers of data to self-service can-doers.
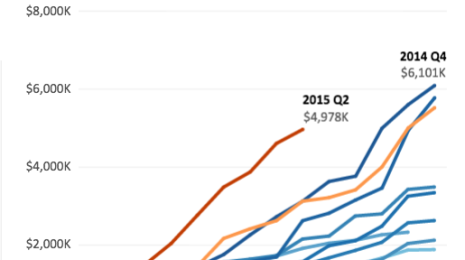 Tableau on Tableau
Tableau on Tableau: 5 ways we look at our sales data
Like any company, Tableau needs to make decisions about sales data. And as a data company, we’re always on the hunt for the best way to look at sales information. Here are five ways we look at our own operations to help make decisions about quota, territory management, and must-win deals.
 Visualizations
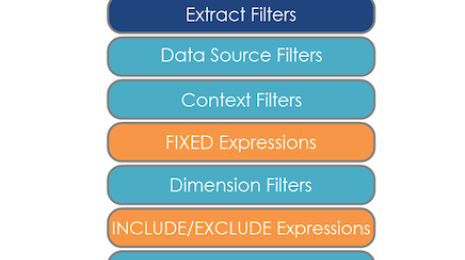
15 principais expressões de LOD
A missão da Tableau é ajudar as pessoas a ver e a entender seus dados. Nossos recursos foram cuidadosamente projetados para ajudar as pessoas a extrair significado dos dados que possuem. Uma das áreas em que nos concentramos são os cálculos. Quanto mais fácil for expressar ideias em uma linguagem de cálculo, mais significado as pessoas podem gerar. A introdução de expressões de nível de detalhe no Tableau 9.0 é revolucionária nesse sentido. Essas novas expressões permitem que as pessoas representem conceitos avançados usando declarações simples.
Tableau on Tableau: Leveraging data for marketing
 14 Outubro, 2014
Do you think big data doesn’t apply to marketing? Wrong: it does. The good news is that it's not too daunting.
 Data
DataUnderstanding Tableau Data Extracts
 18 Julho, 2014
This is the first post in a three-part series that will take a large amount of information about Tableau data extracts, highly compress that information, and place it into memory — yours.
 Tableau Cloud
The power of Tableau, in the cloud
 17 Julho, 2013
Ever wished you could easily share analytics with your colleagues? Ever wanted to collaborate on a dashboard with a customer or partner? Or wish you could access and work securely with data on your tablet, without having to VPN into your corporate network? But you couldn’t. Or you could, but didn’t want to download software or spin up an IT project. If so, then today is a big day. Today we’re announcing Tableau Online, a hosted version of Tableau Server in the cloud. It’s the fastest way to get up and running with a complete business intelligence platform. We take care of the infrastructure, you share analytics. It’s that easy.

Marketing Teams Putting Data to Work
As a marketing professional, I have a soft spot for customer stories that showcase Tableau at work in marketing departments. So it’s gratifying when I hear about customers combining their data muscle and Tableau chops to segment audiences, engage prospects, and provide meaningful content about their product or service.
Subscribe to our blog
Receba em sua caixa de entrada as atualizações mais recentes do Tableau.