Tutte le storie di Visualizations
 Visualizations
Charting the Heart: Data Visualizations on Love
 14 Febbraio, 2024
A curated list of 24 data visualizations celebrating love, relationships, and Valentine’s Day.
14 Febbraio, 2024
A curated list of 24 data visualizations celebrating love, relationships, and Valentine’s Day. Visualizations
Cinematic Insights: The Art of Movie Analytics
 19 Dicembre, 2023
Tableau Visionary Zach Bowders shares how he found his passion for visualizing movie data.
19 Dicembre, 2023
Tableau Visionary Zach Bowders shares how he found his passion for visualizing movie data. Visualizations
Touchdowns and Trends: College Football Through Data Visualization
 2 Settembre, 2023
Heated rivalries, conference realignment, stadium capacity, fan maps, game predictions and more. Explore the data visualizations on all things college football.
2 Settembre, 2023
Heated rivalries, conference realignment, stadium capacity, fan maps, game predictions and more. Explore the data visualizations on all things college football. Gartner
How Tableau Showcases the Power of Data, Innovation at Gartner BI Bake-Off
 23 Maggio, 2023
Each year, Gartner invites leaders to take part in their Analytics & BI Bake-Off, where platforms highlight their capabilities across categories, including data management, analysis, storytelling, and innovation.
23 Maggio, 2023
Each year, Gartner invites leaders to take part in their Analytics & BI Bake-Off, where platforms highlight their capabilities across categories, including data management, analysis, storytelling, and innovation.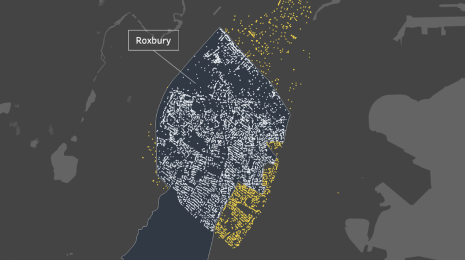 Tips & Techniques
How to Use the Intersects() Calculation in Tableau
 27 Marzo, 2023
Learn about the Intersects calculation in Tableau, which allows you to find spatial intersections via calculated fields at the workbook level—rather than in a join.
27 Marzo, 2023
Learn about the Intersects calculation in Tableau, which allows you to find spatial intersections via calculated fields at the workbook level—rather than in a join. Visualizations
Football Data Visualization Inspiration: 38 Vizzes from the Gridiron
Receiver routes, fan maps, and game predictions—see the curated collection of American football visualizations created in Tableau. Visualizations
What is Tableau Public’s Viz of the Day?
 4 Febbraio, 2023
Learn all about Viz of the Day—a daily dose of inspiration that sparks meaningful data conversations, showcases what’s possible in Tableau, and elevates data visualizations from the Tableau Community.
4 Febbraio, 2023
Learn all about Viz of the Day—a daily dose of inspiration that sparks meaningful data conversations, showcases what’s possible in Tableau, and elevates data visualizations from the Tableau Community. Visualizations
What is Tableau Public?
Get started with Tableau Public, a free online visual analytics platform that allows you to learn data skills, create and explore data visualizations, discover data stories, and create your own portfolio of work to share with your network. Visualizations
How to Get Started Analyzing Football Data in Tableau
 18 Dicembre, 2022
The Tableau Community has a wealth of resources to accelerate your football and soccer analytics journey.
18 Dicembre, 2022
The Tableau Community has a wealth of resources to accelerate your football and soccer analytics journey. Visualizations
How to Visualize Your Music Data
 19 Novembre, 2022
Step by step instructions to see and understand your music listening data using Tableau.
19 Novembre, 2022
Step by step instructions to see and understand your music listening data using Tableau. Visualizations
Exploring Spatial Relationships in Tableau
 13 Ottobre, 2022
Maps are a great tool to visually analyze spatial patterns. In Tableau, it’s simple to add multiple layers of data on top of a custom base map to easily see patterns.
13 Ottobre, 2022
Maps are a great tool to visually analyze spatial patterns. In Tableau, it’s simple to add multiple layers of data on top of a custom base map to easily see patterns. Visualizations
Come trovare le migliori origini per accedere a dei set di dati pubblici gratuiti
 26 Febbraio, 2019
Jacob Olsufka ci propone alcuni suggerimenti per trovare il set di dati perfetto per il prossimo progetto di visualizzazione.
26 Febbraio, 2019
Jacob Olsufka ci propone alcuni suggerimenti per trovare il set di dati perfetto per il prossimo progetto di visualizzazione.
Subscribe to our blog
Ricevi via e-mail gli aggiornamenti di Tableau.