Top 10 Qualifiers for Iron Viz 2025
Since 2011, Tableau has brought the world’s premier data visualization competition, Iron Viz, to Tableau Conference each year. The competition culminates in a thrilling 20-minute showdown where three finalists, using the same data set, craft their most compelling stories live on stage. The journey to the championship begins with a qualifier round, with all stages judged by the same set of criteria.(More on that below.) This event is unlike any other, celebrating data skills, data storytelling, and the power of the Tableau Community.
The 2025 Iron Viz Qualifier competition results are in, revealing this year’s finalists! This year’s theme is entertainment. From movies and tv, board games, sports, live music and beyond—the DataFam were challenged to viz what amuses them. The theme ignited a spark for many, inspiring 191 entrants—112 submitting visualizations for the first time–with 2 of the top 10 being first-time submissions.
Among the hundreds of entries, 10 visualizations impressed the judges’ and made it to the top 10. But three of these visualizations rose to the top of the list to advance to the Iron Viz Championship at Tableau Conference 2025 in San Diego, April 15-17.
How are the Iron Viz Qualifiers judged?
The judging panel—which is made up of Tableau Ambassadors, Visionaries, and former Iron Viz finalists—reviews all submissions, doing the difficult task of selecting the finalists, using the following criteria to score all entries:
- Design: How appropriate is the design for the story being told?
- Storytelling: Is a clear story being told or a question being explored, and is there appropriate context?
- Analysis: How sophisticated and appropriate is the data that is being used for the story?
Thank you to our community judges for dedicating their time and expertise: Abdelaziz Mahjoub, Ali Tehrani, Alice McKnight, Candice Munroe, Caroline Swiger, Cecilia Fryar, Chris Williams, Deborah Simmonds, Eman Alvani, Fraser Gallop, Igor Garlowski, James Emery, Jen Shepherd, Jessica Moon, Jim Dehner, Joshua Milligan, Kyle Yetter, Mo Wooten, Ojoswi Basu, Pablo Gomez, Paula Muñoz, Preethi Lodha, Priya Padham, Priyanka Dobhal, Roshni Gohil, Samuel Parsons, Sienna Lei, Timothy Vermeiren, Tore Levinsen, Whitney Wood, Will Perkins, Will Sutton, Youssef Dawoud
Who did the judges determine created the top 10 vizzes?
It’s no secret that the Iron Viz Qualifier is a demanding challenge that tests entrants’ skills in every way through data sourcing and preparation, trying new features and techniques, data storytelling, and applying beautiful designs. Each submission is an achievement and we commend all applicants for their hard work in creating these visualizations. Explore the 2025 Iron Viz Entries.
2025 Iron Viz finalists
These three visualizations rose to the top and their authors will advance to the Iron Viz Championship in April.
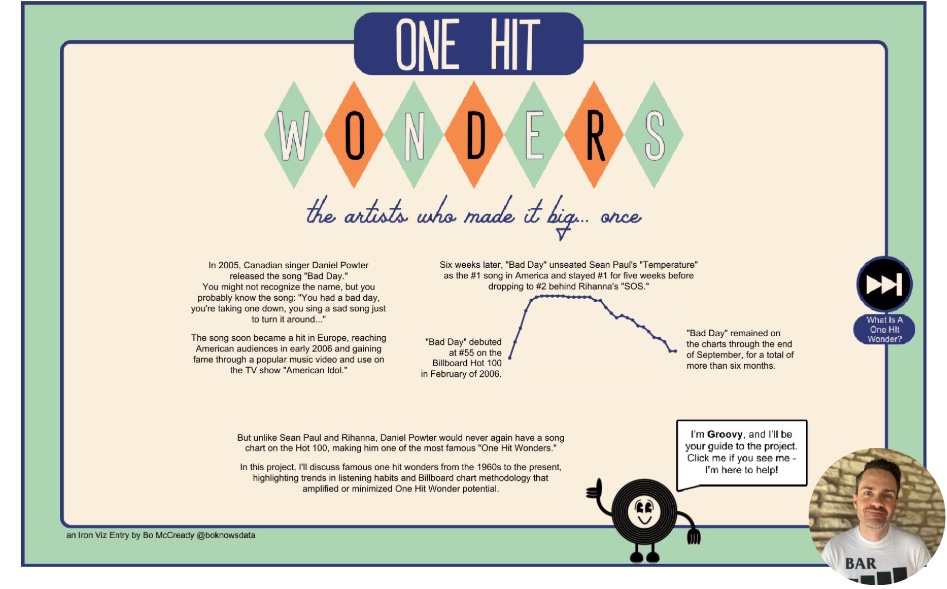
One Hit Wonders
by Bo McCready
Austin, Texas, United States
Bo McCready: I've been using Tableau since 2012, when I started my career and my boss bought a Tableau license for me to explore the tool and see if we could find a good use case. I started engaging with the broader Tableau community in 2018 and began sharing creative work on both Tableau Public and Reddit, which transformed my career and opened up opportunities and connections I'd never dreamed were possible! This is my 7th Iron Viz entry and I have three previous top 10 qualifier finishes.
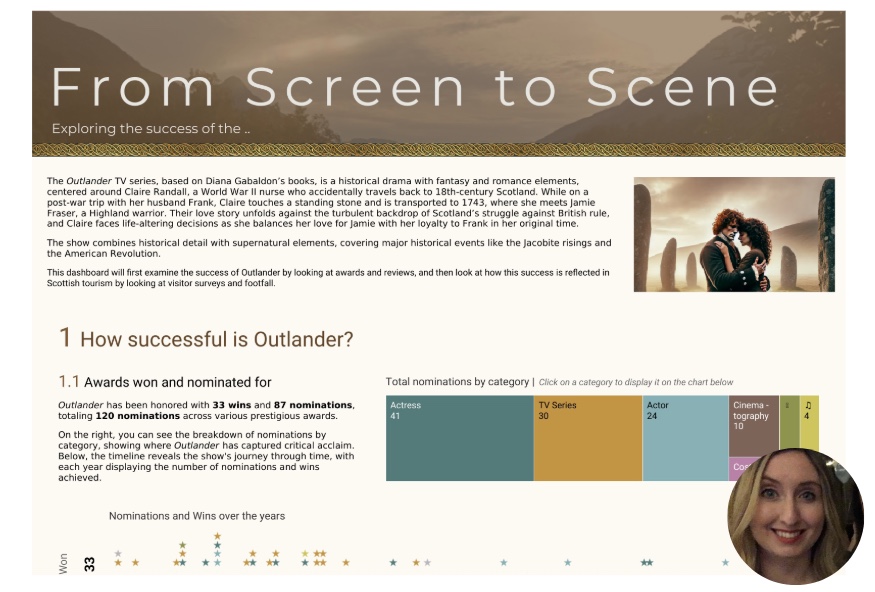
From Screen to Scene
by Kathryn McCrindle
Auderghem, Brussels
Kathryn McCrindle: At university, I learned the basics of creating charts in Excel and R, but my perspective on data visualization completely changed when I started my first full-time job and was introduced to Tableau. I was amazed at how intuitive and interactive it was—it made storytelling with data so much more accessible and engaging. This is my first time entering Iron Viz.
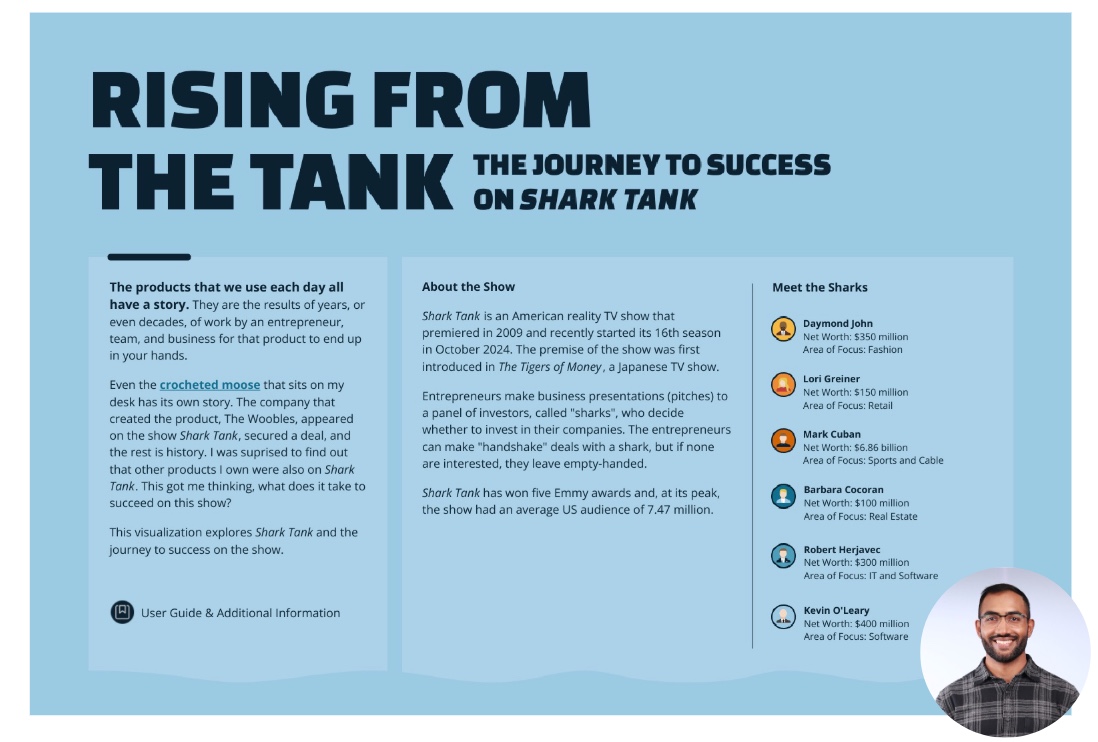
Rising from the Tank
by Ryan Soares
Ajax, Ontario, Canada
Ryan Soares: I've been using Tableau for 8 years. I started after my brother encouraged me to learn it and I used it for a few internships. I’ve participated in Community Projects including Makeover Monday to learn more about the tool. Over time, data visualization has become a hobby as I got more involved in the Tableau community. This is my fifth time entering Iron Viz.
Iron Viz runners up
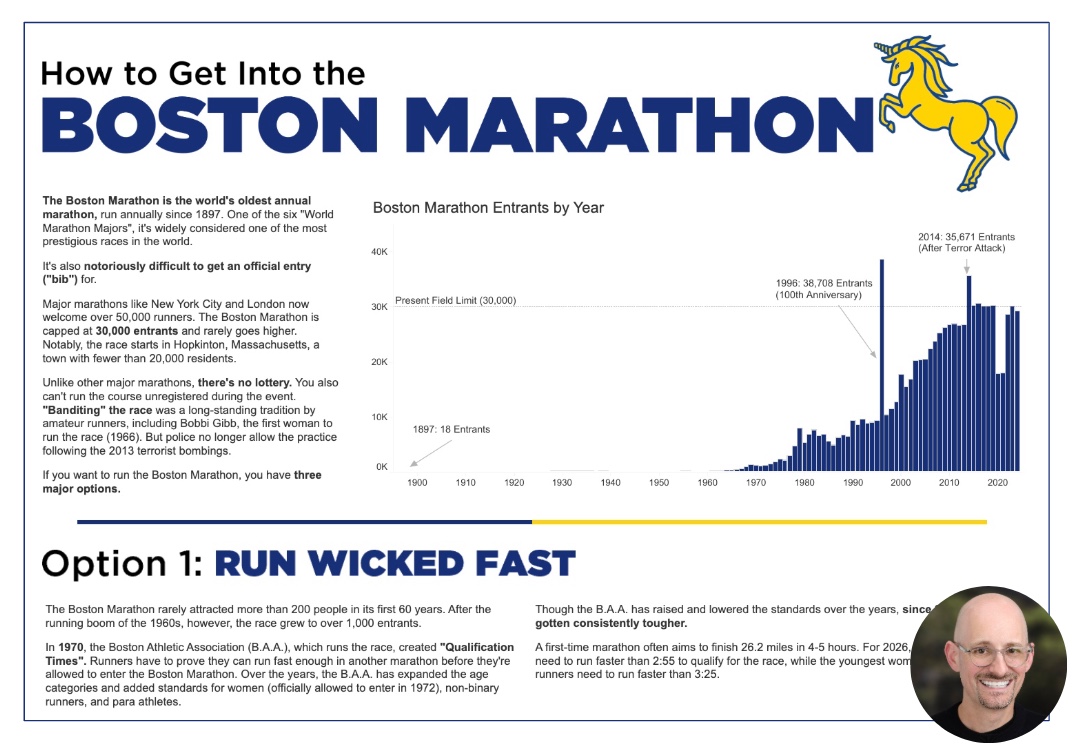
How to Get Into the Boston Marathon
by Branden Kornell
Somerville, Massachusetts, United States
Branden Kornell: As a Boston local and a recreational runner, I jumped at the chance to tell a story about the Boston Marathon, the world's oldest annual marathon. It's considered very prestigious to run in, because it doesn't have a lottery for entry: most entrants have to qualify by running an extremely fast time in an earlier marathon. I've never seen a viz that explains how hard it is to just get an official entry in the race. I think this is my third time entering Iron Viz.
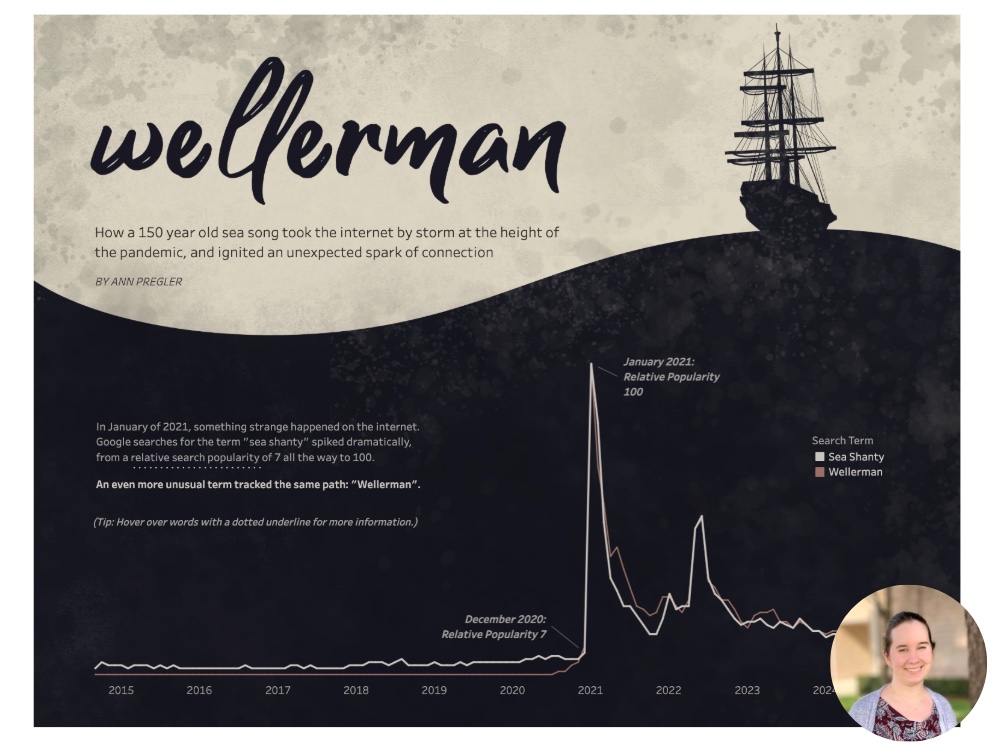
Wellerman
by Ann Pregler
Battleground, Washington, United States
Ann Pregler: I've loved folk music for a long time, but I was as confused as anyone when sea shanties and "Wellerman" suddenly went viral during the pandemic. I think that some of the best storytelling comes from questions that genuinely make you ask, "Wait, what the heck?", and this was one of the strangest moments I've ever seen in the genre! I loved diving deeper into the song’s background to understand all the factors that led up to that moment. This is my second time entering Iron Viz.
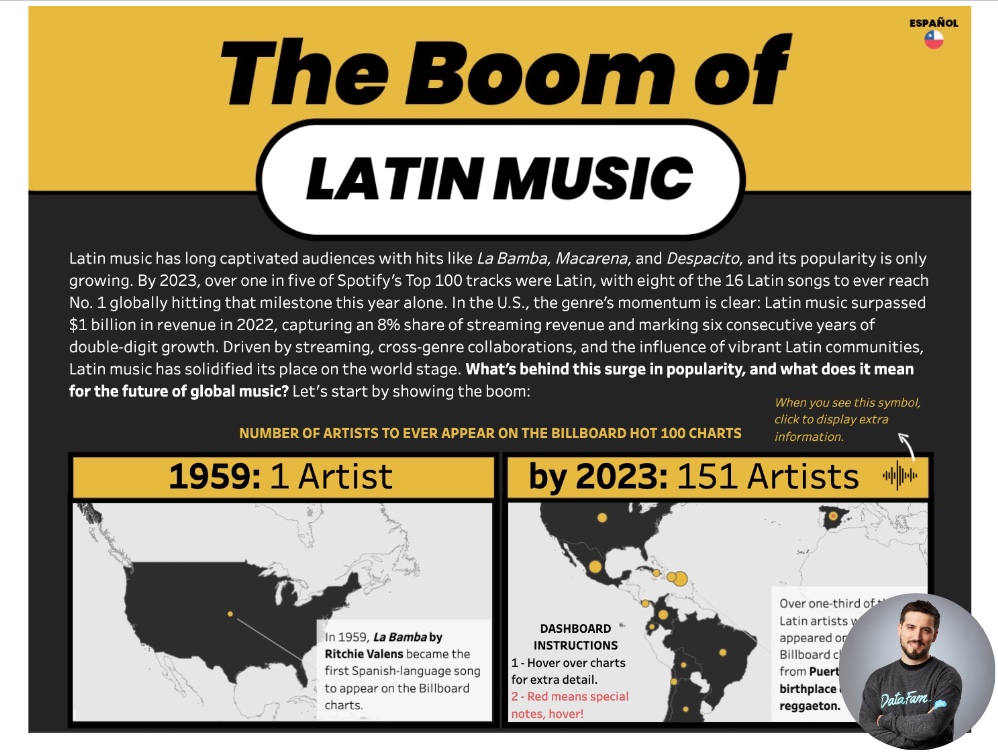
The Boom of Latin Music
by Diego Parker
London, United Kingdom
Diego Parker: I've entered three times and every time I've been in the top 10. I take Iron Viz as the opportunity to do a viz related to Latin America and spend more time doing a bit of research on the topic. The inspiration for this visualisation came from a conversation with one of my Comunidatos co-leads about wanting to collaborate to produce a viz around Latin Music. At the time we couldn't find the right data but the idea stayed in my head and for this viz I ended up creating my own data set by scraping multiple sites.
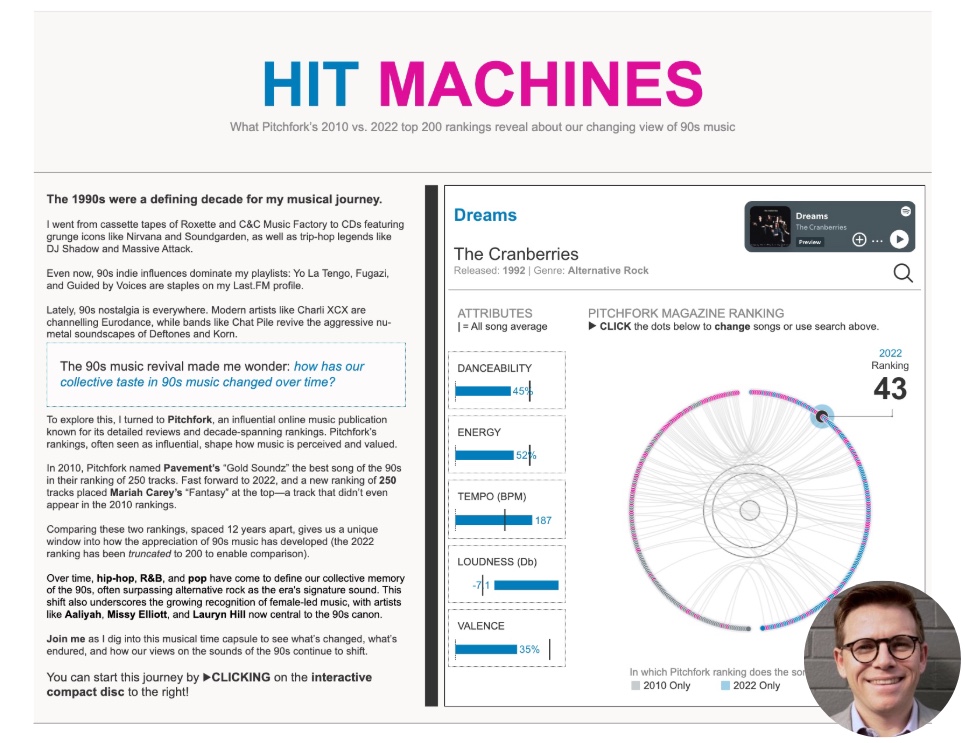
Hit Machines
by Darragh Murray
The Gap, Queensland, Australia
Darragh Murray: My friends call me the “almanac of 1990s music” – essentially during my teenage years I spent a lot of my time listening to popular (and even unpopular) music. Later I worked for a time as a music journalist in both print and radio. I have always been fascinated by how people “understand” or “appreciate” different eras of music, and the dataset I built to do my analyses was approached with this sense of curiosity. This is my second time entering Iron Viz.
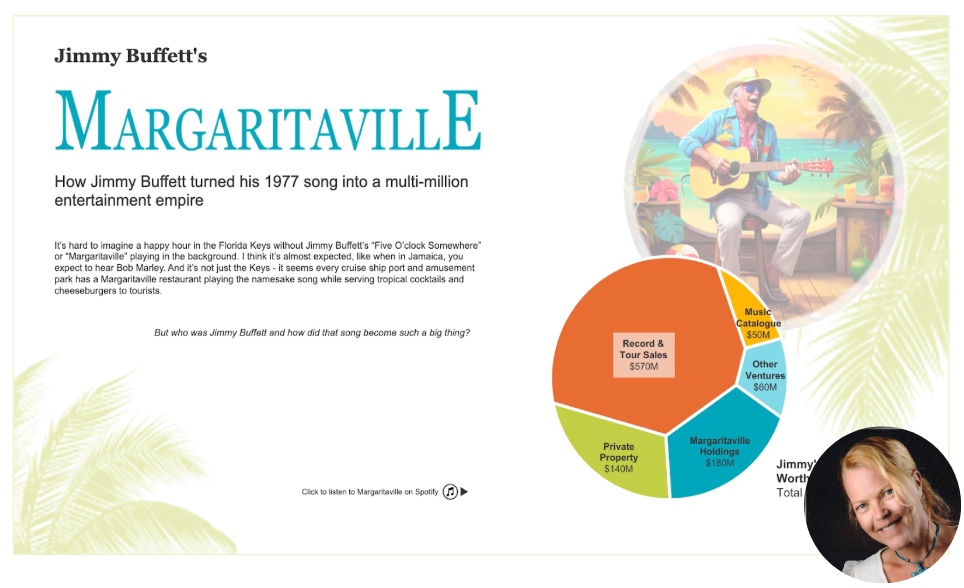
Jimmy Buffett's Margaritaville
by Raisa Hannus
Key Largo, Florida, United States
Raisa Hannus: I had some potential topics in mind but researched entertainment when the theme was announced and came across a Forbes list of billionaire entertainers. Local Florida Keys celebrity Jimmy Buffett (whose music I’ve heard way too many times!) had made the list just a few months before his passing. I was excited to learn and visualize his story using a tropical theme and colors. This is my third time entering Iron Viz.
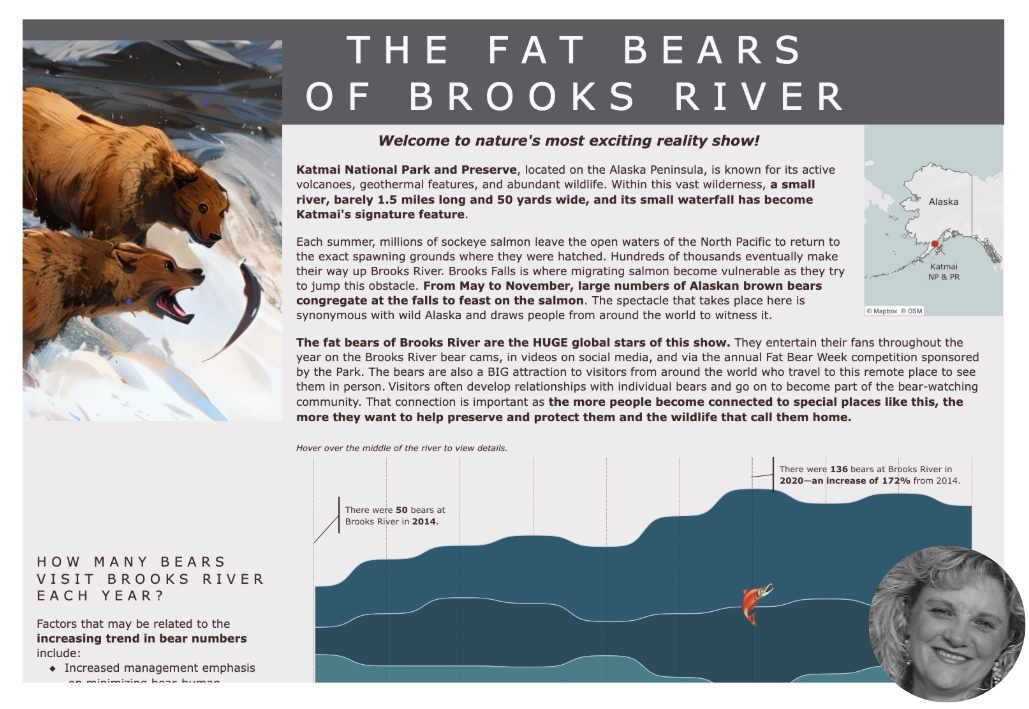
The Bears of Brooks River
by Cherie Bardsley
Dacono, Colorado, United States
Cherie Bardsley: I worked in Yellowstone National Park for 9 years prior to working with data and fell in love with the wildlife, especially the bears. A Park Ranger friend said, “If you love Yellowstone, you should visit Alaska and go see the REALLY BIG bears there!” So, in the summer of 2023, my husband and I took a bucket-list trip to Alaska. One of the places we really wanted to go was Katmai National Park to see the famous bears of Brooks River. I was so inspired by the experience, I built a Tableau viz to tell the story of the bears and raise awareness and interest in this magnificent place. This is my first time entering Iron Viz.
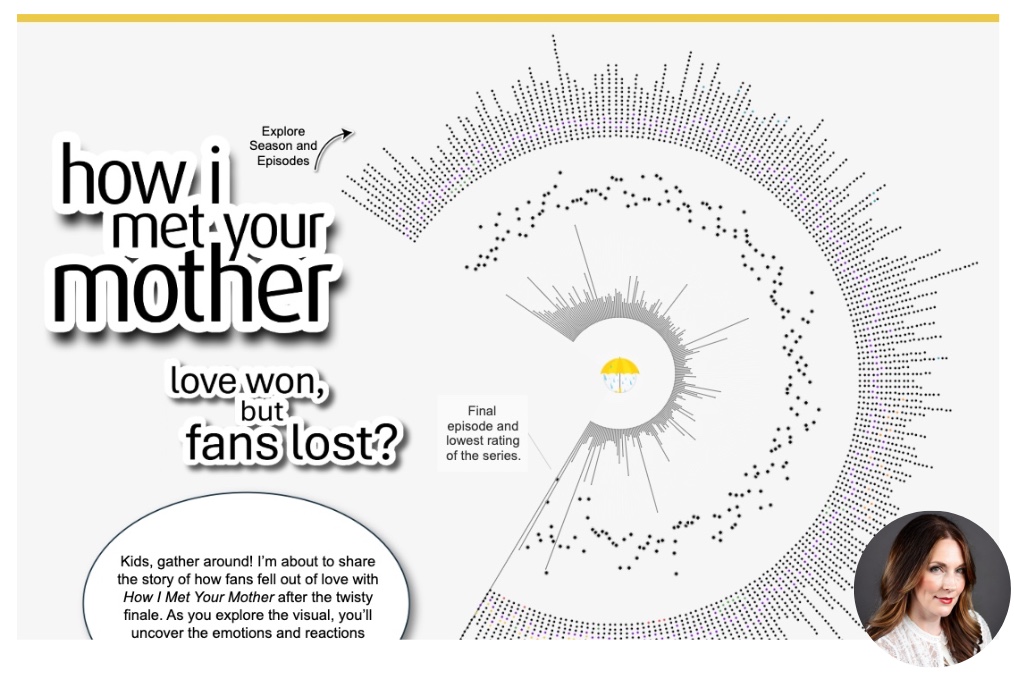
HIMYM Love Won, but Fans Lost?
by Jennifer Dawes
Cincinnati, Ohio, USA
Jennifer Dawes: My first-ever viz used IMDb data, so diving into sitcoms and analyzing episode ratings felt like a natural fit. I decided to take a twist this time—what if I wrote an alternative ending to one of my favorite shows? This is my sixth time entering the Iron Viz competition. Understanding my strengths and the areas I needed to improve by soliciting feedback from previous Iron Viz entries was invaluable in shaping my approach this year.
Over the years, Iron Viz has become more than just a fun challenge—it is my personal marathon. Each year, I push myself further, engage more with the community, and use the competition as an opportunity for growth. For me, it has never been about finishing in the top 3 or even the top 10.
I published my first viz on Tableau Public in 2018 and have been active with the community ever since. Today, I work as an analytics manager and credit my growth and journey to the incredible support and inspiration from the DataFam.
Countdown to the 2025 Iron Viz Championship at Tableau Conference
Congratulations to all of the finalists and thank you to everyone who participated. Who will claim the Iron Viz Champion title this year? The countdown is on to the live competition at Tableau Conference, April 15-17, 2025 in San Diego. Sign up to attend in person or watch on Salesforce+.
Want to experience the excitement of the top 10 finalists announcement with championship co-hosts, Andy Cotgreave, Archana Ganeshalingam, and three qualifier judges? Watch on-demand.
Historias relacionadas
Suscribirse a nuestro blog
Obtén las últimas actualizaciones de Tableau en tu bandeja de entrada.


