How To Get Your Fitness Data Ready For Tableau
My whole life changed after February 2018. My daughter was born and I became a parent. Being a parent was something I always knew I wanted to be, but nothing could have prepared me for the cycle of constant exhaustion. Being a new parent led to no physical activity, poor diet, and lack of sleep hygiene. I was eventually able to get back into shape after some time, but this cycle repeated itself when my second daughter was born.
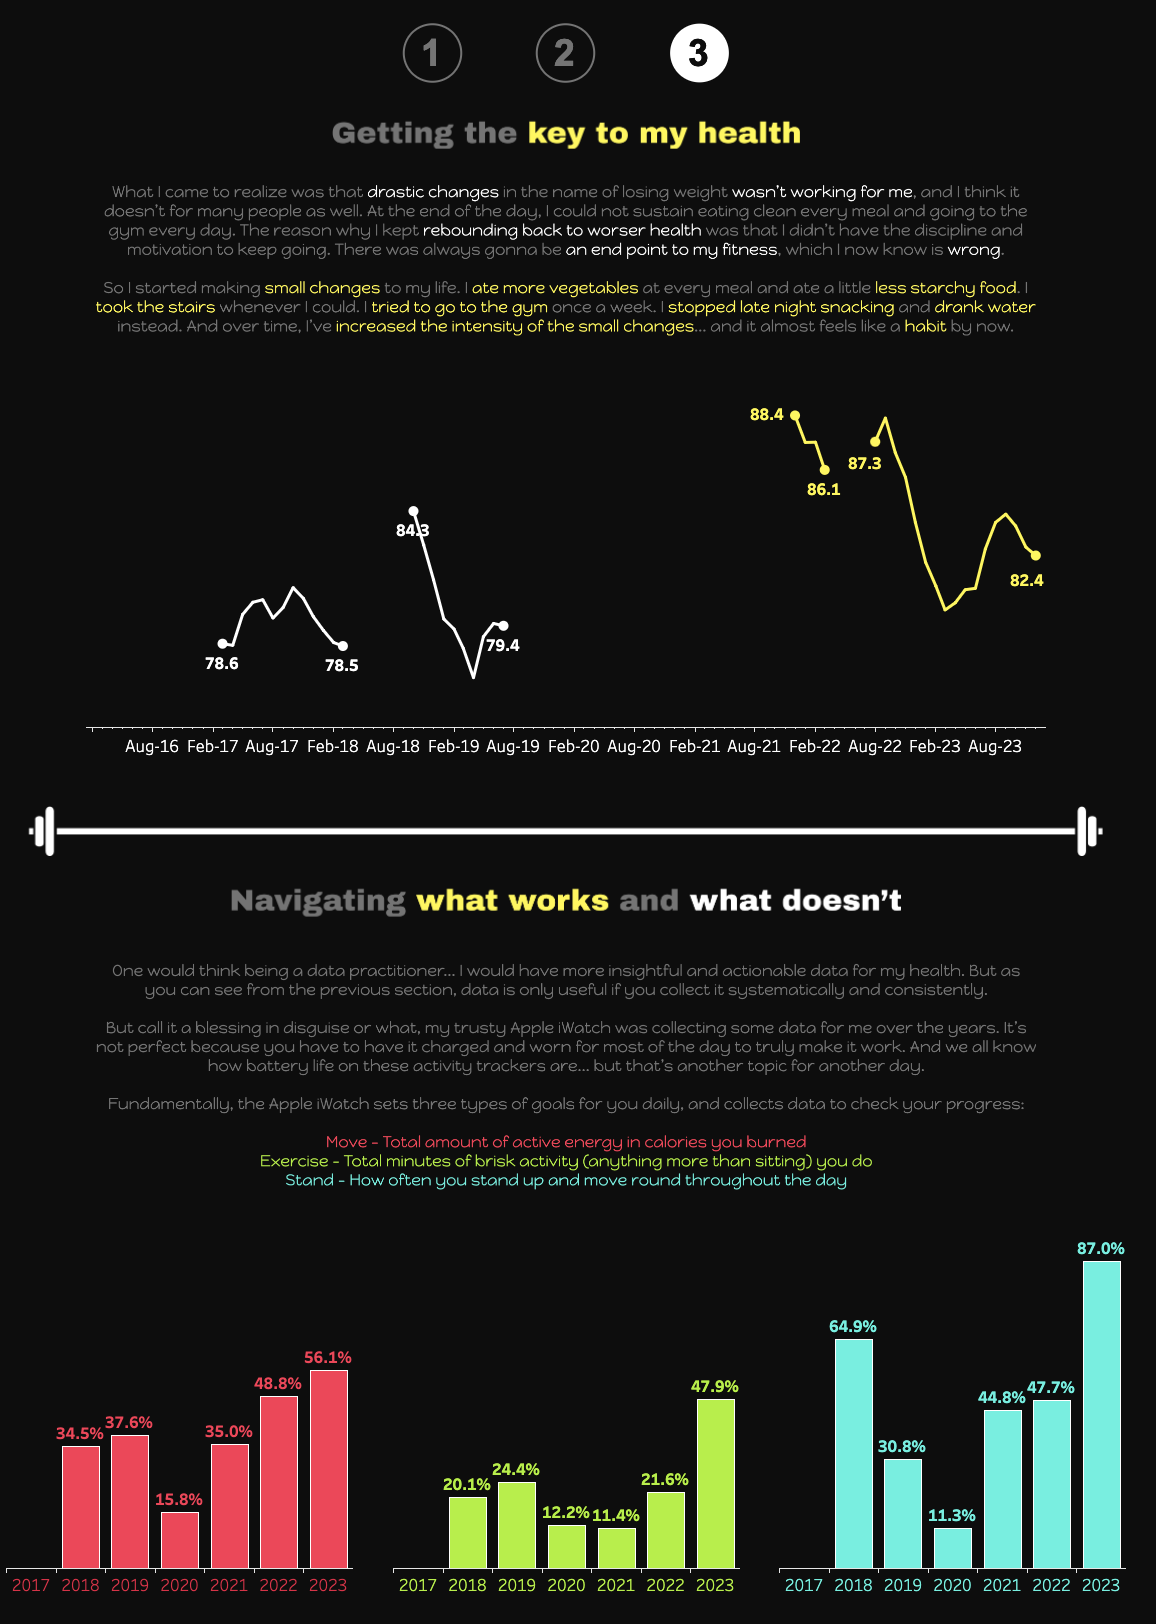
So as a data guy, I sought to find answers to help optimize and sustain my health. It turns out my Apple Watch has a lot of clues to the answers I was looking for. To get the data I needed, I made sure to always wear my Apple Watch and started consistently measuring my body weight.
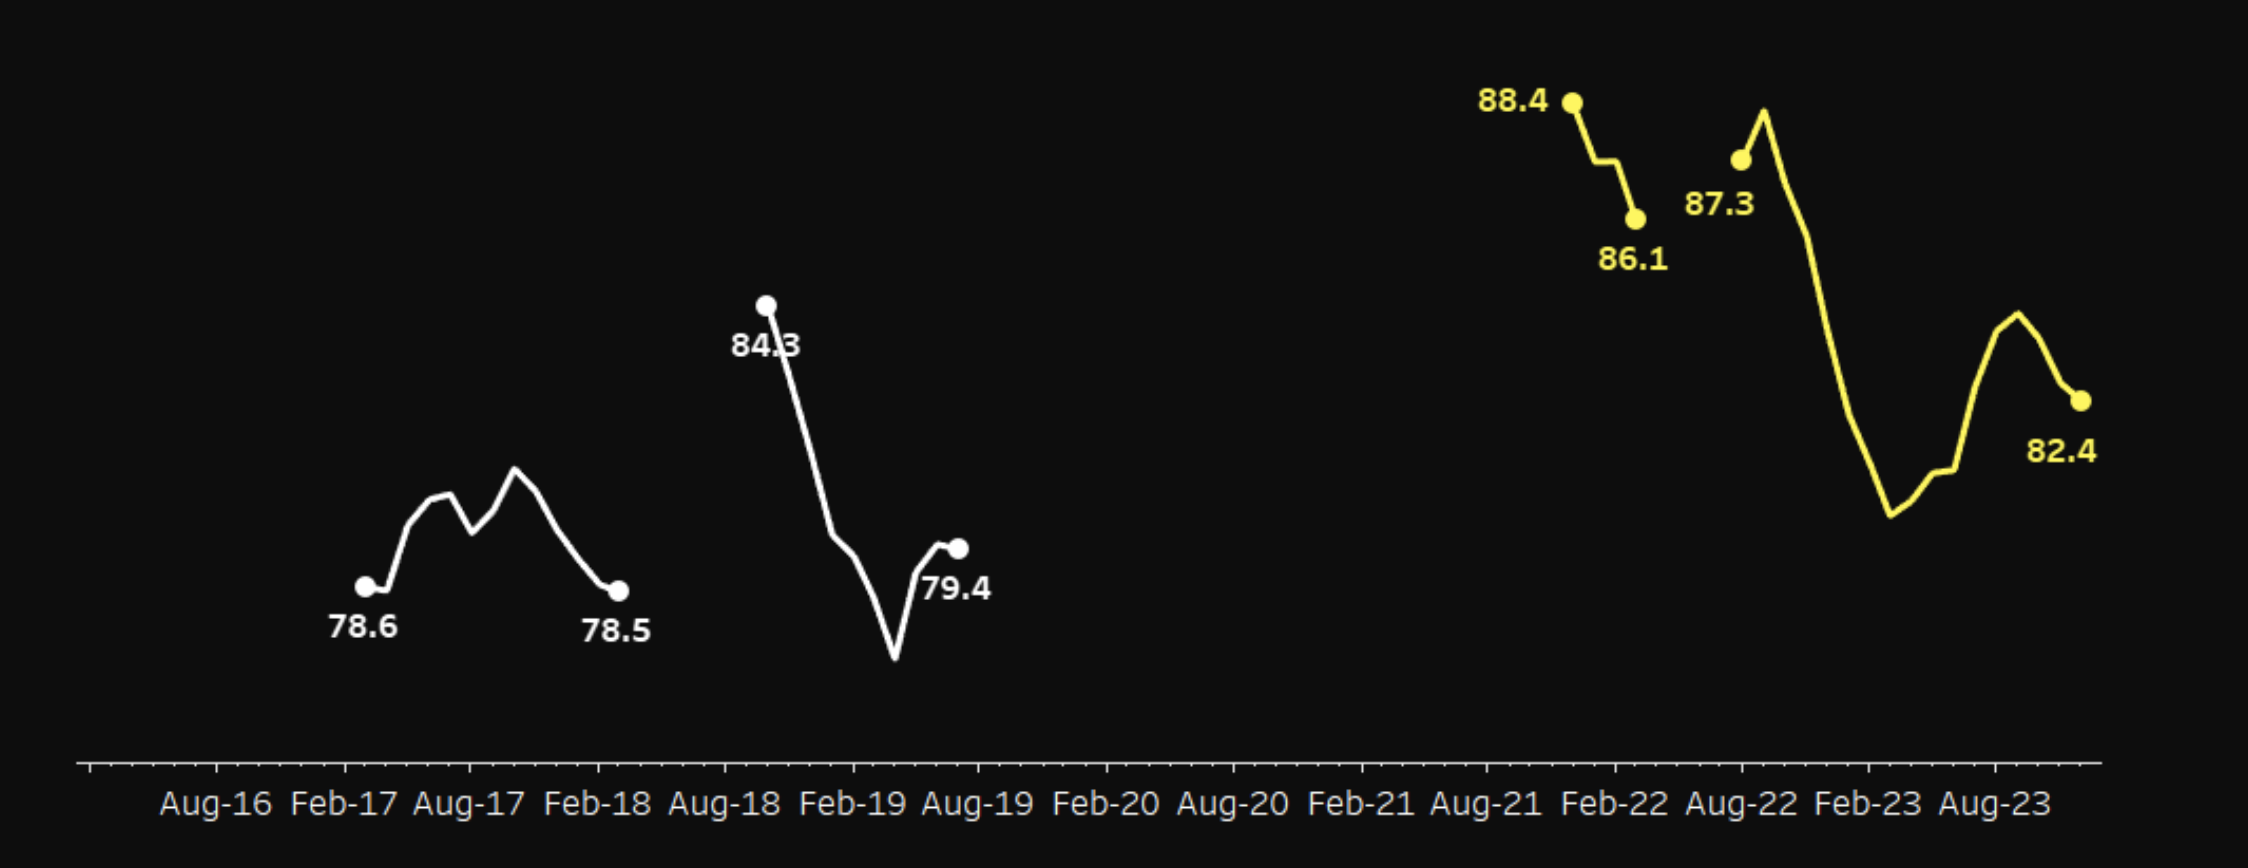
Consistently tracking my data coupled with a few small changes to my lifestyle and diet, I began to see results.
DataFam, if you’re interested in tracking and improving your health—and using Tableau to take it one step further—I’m excited to show you how.
Getting Your iPhone Health Fitness Data
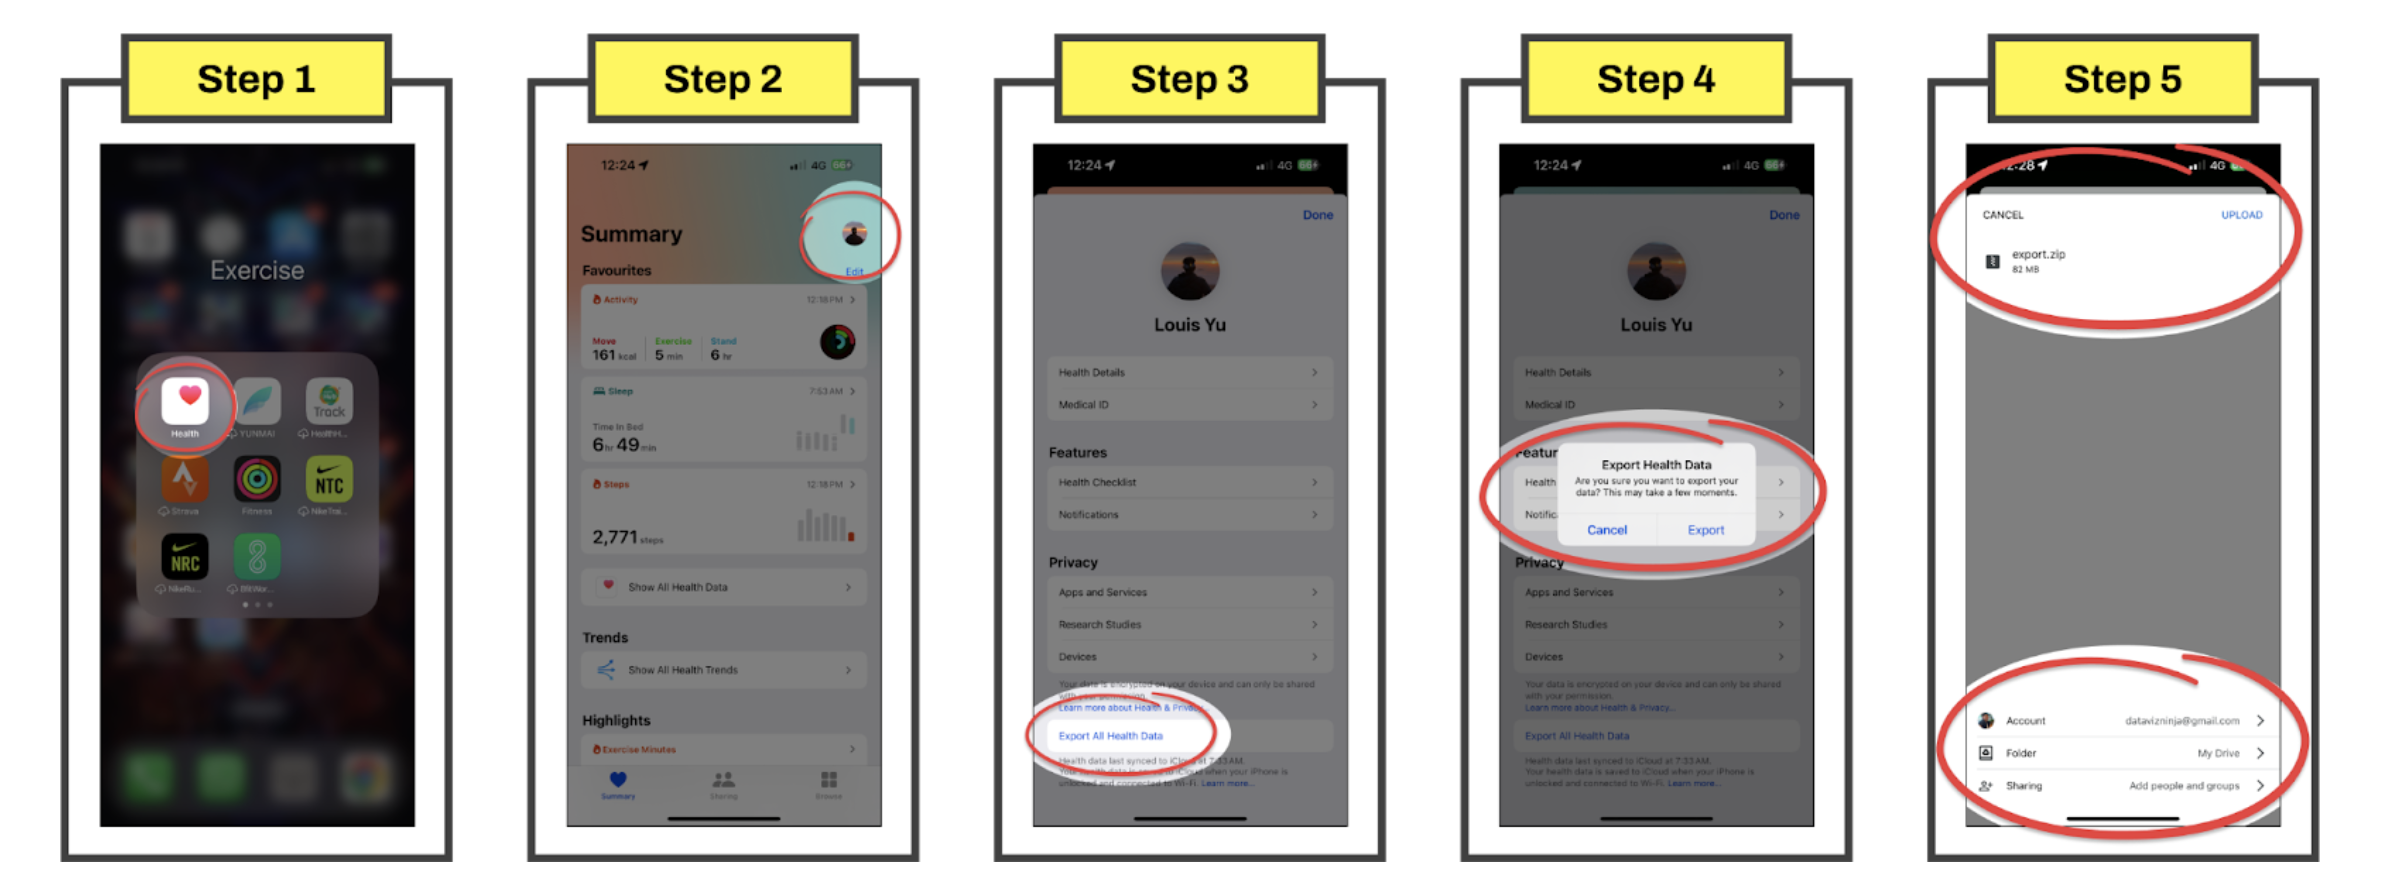
- Navigate to the Health app on your iPhone
- Click on your portrait at the top right corner
- Select Export All Health Data right at the bottom
- Click on the Export button and choose a destination
- It is recommended to put it to a Google Drive / One Drive so you can easily download it on your PC. Sending it by email may or may not work, as it may come with an attachment size limit.
Cleaning the Data
The file that you download will be a compressed zip format and you will need to extract it out into a folder. There are a few files, but the only one you need to use is export.xml
If you try to open up this XML file in a notepad, you will notice a lot of metadata and it’s not as straightforward as just plugging this into Tableau to start vizzing. Some folks use the code approach and parse it through a Python workbook, but it can be daunting if you’re unfamiliar with coding. Fret not, we will do this the Tableau Prep way!
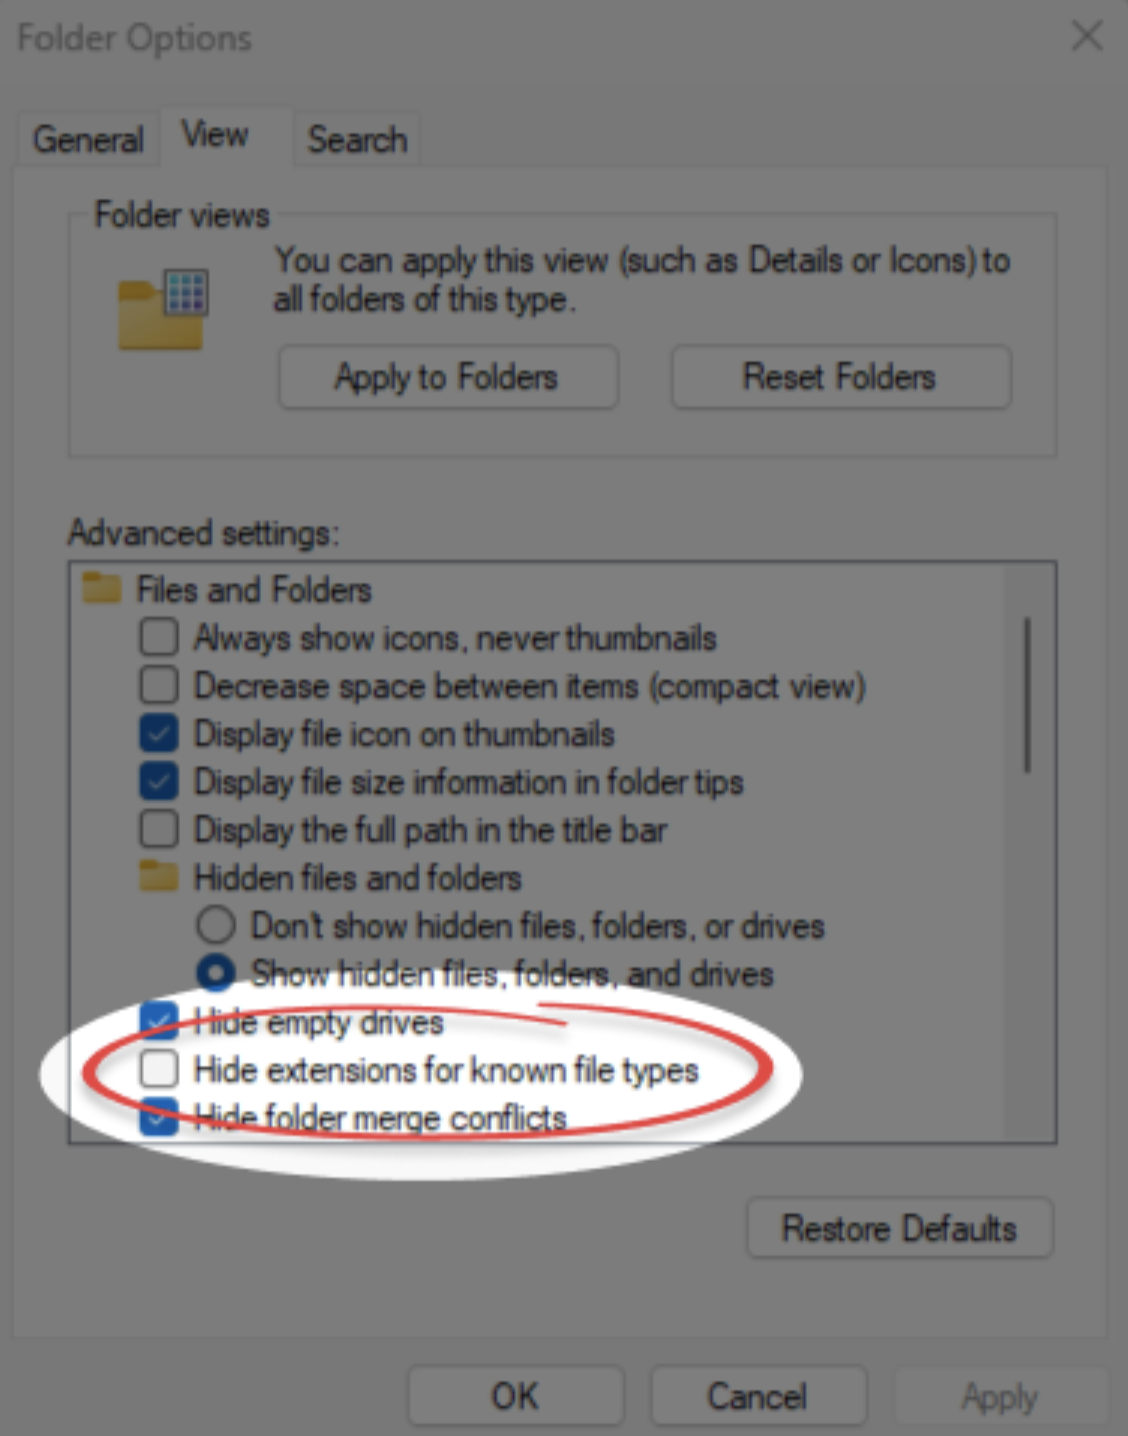
To start, you need to change your XML file into a TXT file, and you can simply right-click, select rename, and change “.xml” to “.txt”.

If you don’t see the file extension, you might need to uncheck “Hide extensions for known file types” in your folder options.
XML Or TXT Files, Does It Matter?
Why are we changing the file to TXT? Unfortunately, XML is still not supported in Tableau (You can drop a vote in the ideas forum to push it up a little bit) so we needed to work around it. Now that’s settled, you can connect that file in Tableau Prep.
With most proper datasets, Tableau Prep does a great job in parsing it but we do want a customized method this time. So make sure you apply these settings so that it returns a unique row for every data in the file (including the metadata).
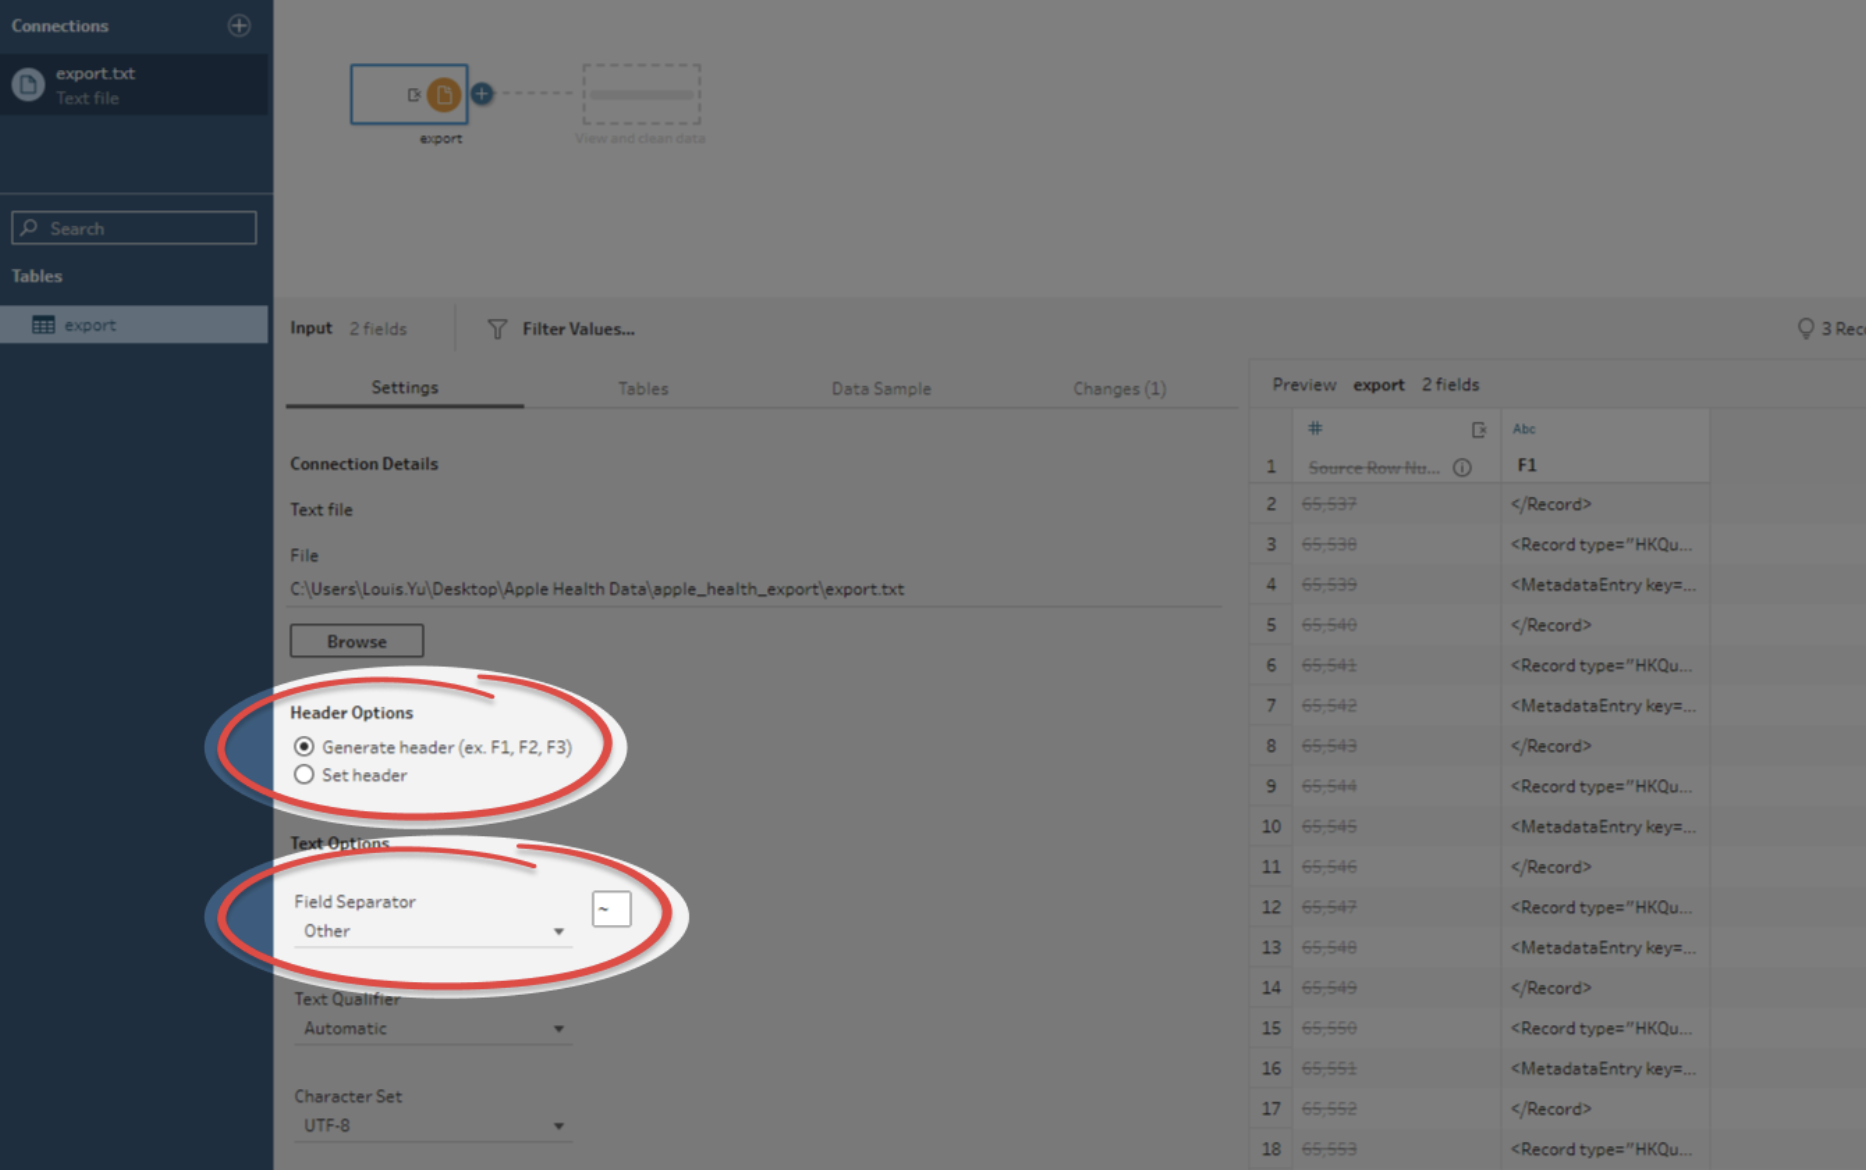
You can use a tilde (~), backslash (\), or any symbol currently not present in the file, just make sure you do a FIND and ensure there are no records found. And since this symbol can’t be found as a delimiter to break up the data into multiple columns, Tableau Prep returns everything in one column. This ensures we don’t break up the data within each XML tag as each tracked activity have different number of columns Also, under the Data Sample settings, be sure to select Stratified for row selection so that some records are being pulled for each activity type. This helps with the cleaning steps below.
Step 1: Remove Trailing Spaces
Add a Clean Step after the first data node and create a calculated field. Add a TRIM function to remove the spaces in front and behind of each row data, as XML often has indenting practices.
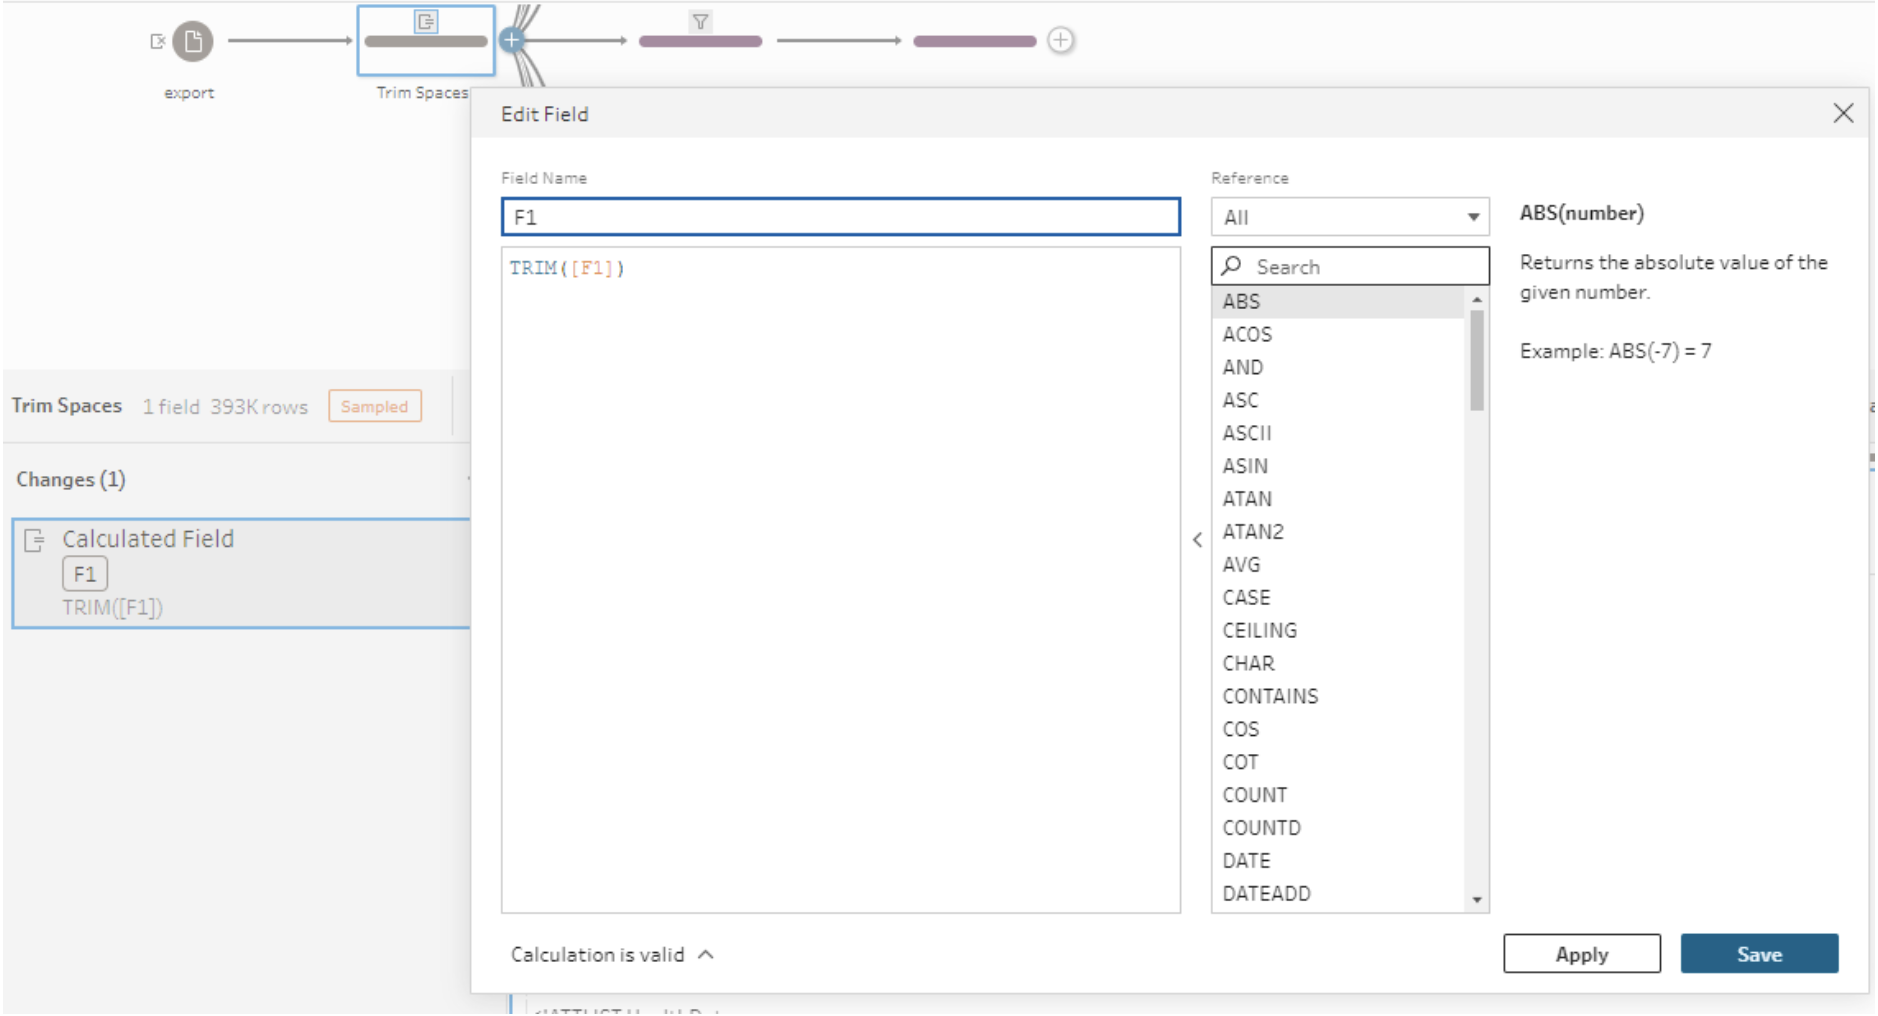
Quick tip, if you name the new calculated field as any existing fields, it replaces it (saving 1 more delete step).
Step 2: Add Each Activity As a Separate Flow
The next steps involve filtering down into the various track activities by using a Clean step and STARTSWITH formula branching off the previous step.
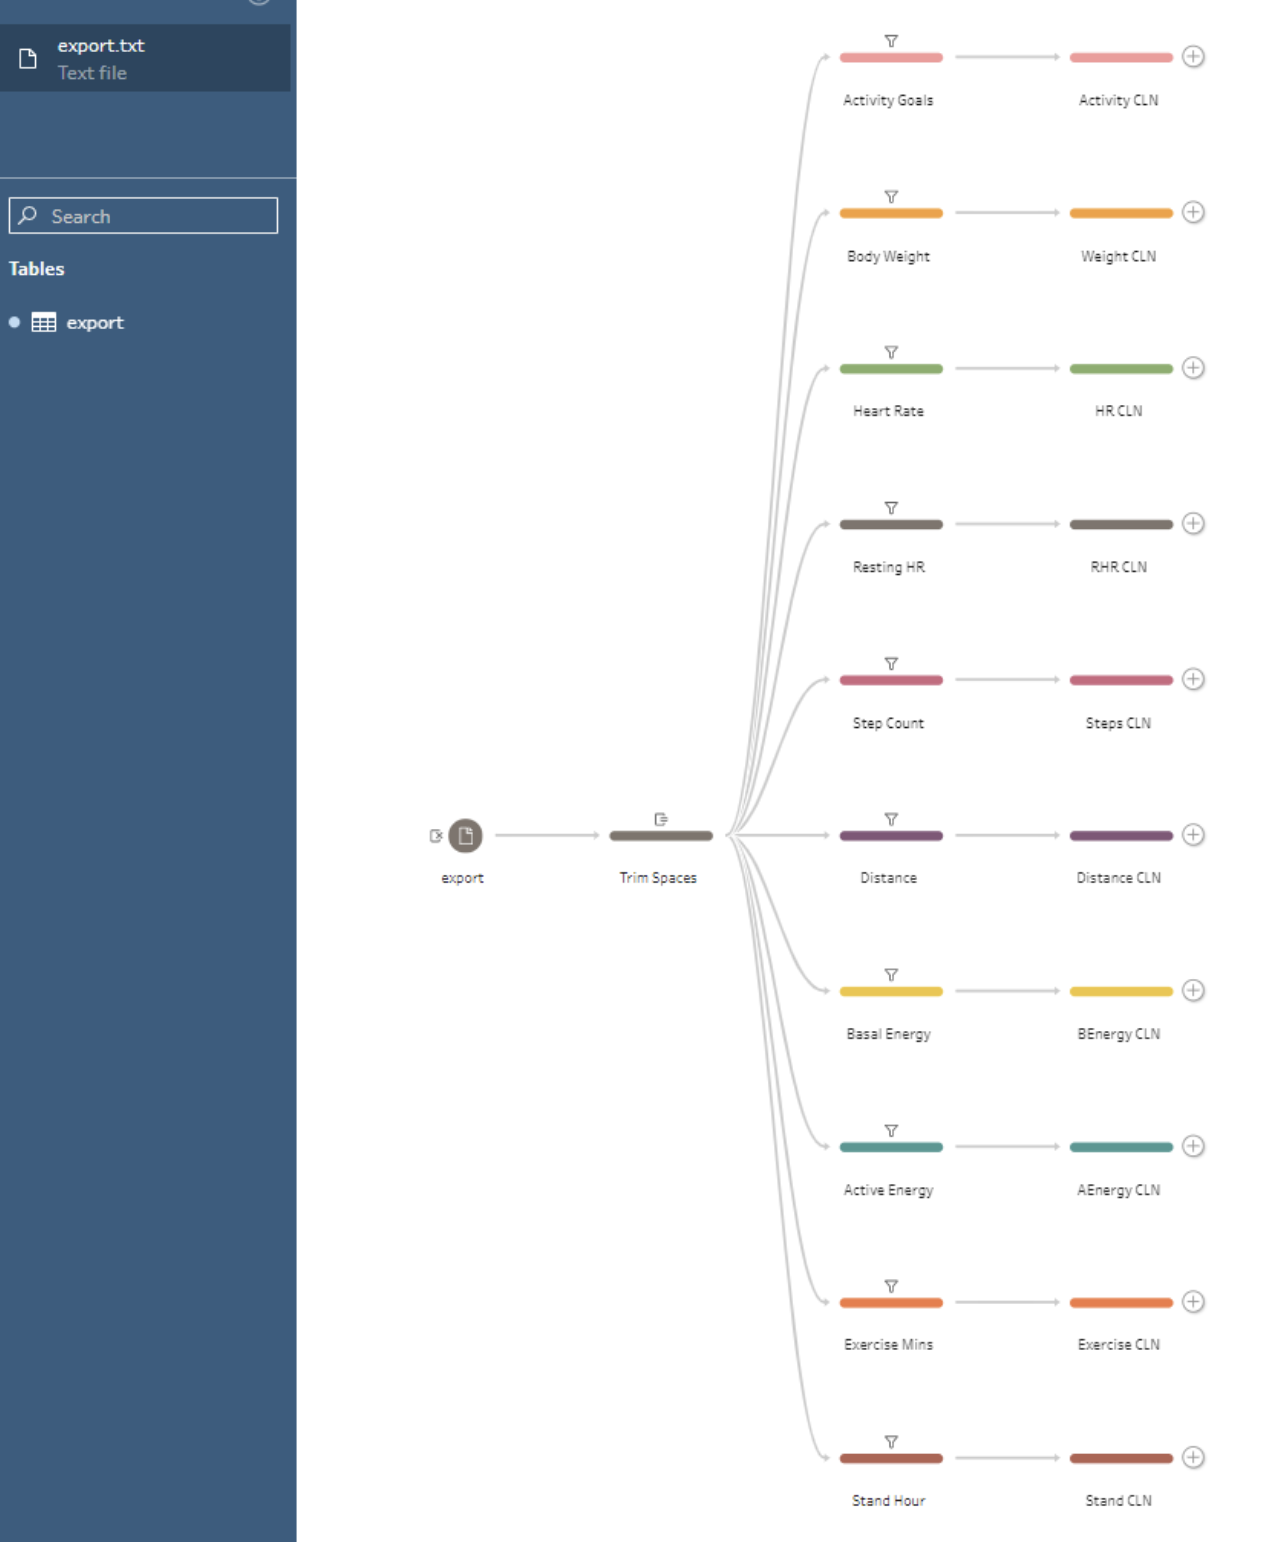
The formula syntax would be STARTSWITH( [F1], Activity Name ) and you can pick the activity names from below.:
- ‘<ActivitySummary '
- ‘<Record type="HKQuantityTypeIdentifierBodyMassIndex"’
- '<Record type="HKQuantityTypeIdentifierHeartRate"'
- '<Record type="HKQuantityTypeIdentifierRestingHeartRate"'
- '<Record type="HKQuantityTypeIdentifierStepCount"'
- '<Record type="HKQuantityTypeIdentifierDistanceWalkingRunning"'
- '<Record type="HKQuantityTypeIdentifierBasalEnergyBurned"'
- '<Record type="HKQuantityTypeIdentifierActiveEnergyBurned"'
- '<Record type="HKQuantityTypeIdentifierAppleExerciseTime"'
- '<Record type="HKQuantityTypeIdentifierAppleStandTime"'
- '<Record type="HKCategoryTypeIdentifierAppleStandHour"'
Step 3: Split the Data Into Columns
Add a Clean Step after each activity. One way of splitting up the columns is to use Custom Split.Right-click on the column F1 > Split Values > Custom Split. Use these settings below to ensure each column is split out properly. Make sure the delimiter has a space after the double quotes so it searches correctly.
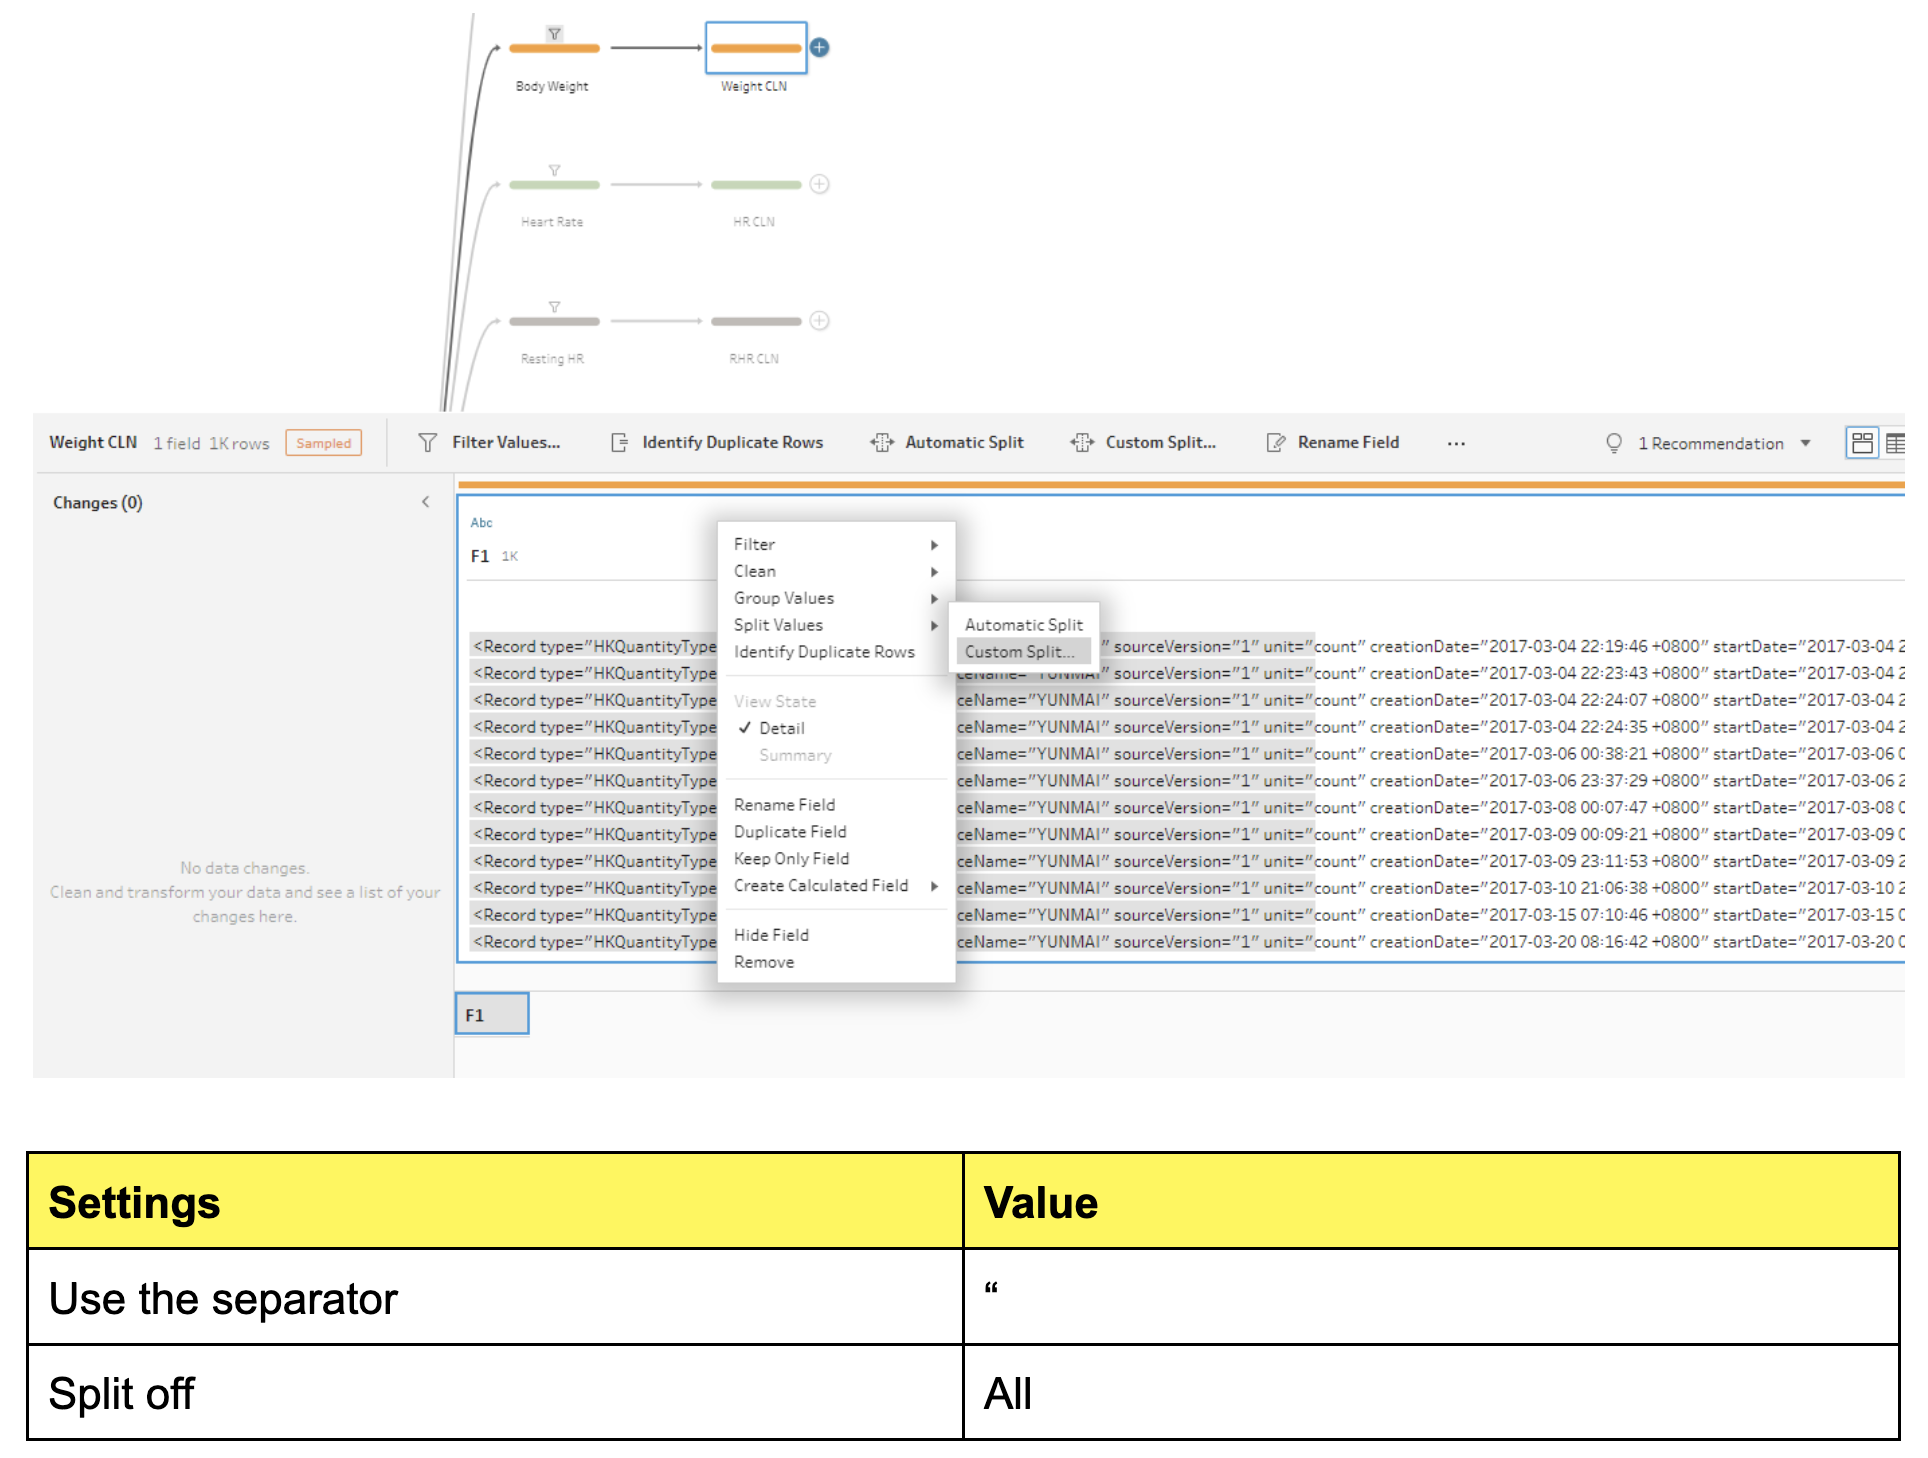
Now that each column is separate, you can add additional steps like removing the field names (using text functions like REPLACE, LEFT, RIGHT, MID or even REGEX) and changing the data to their corresponding types.
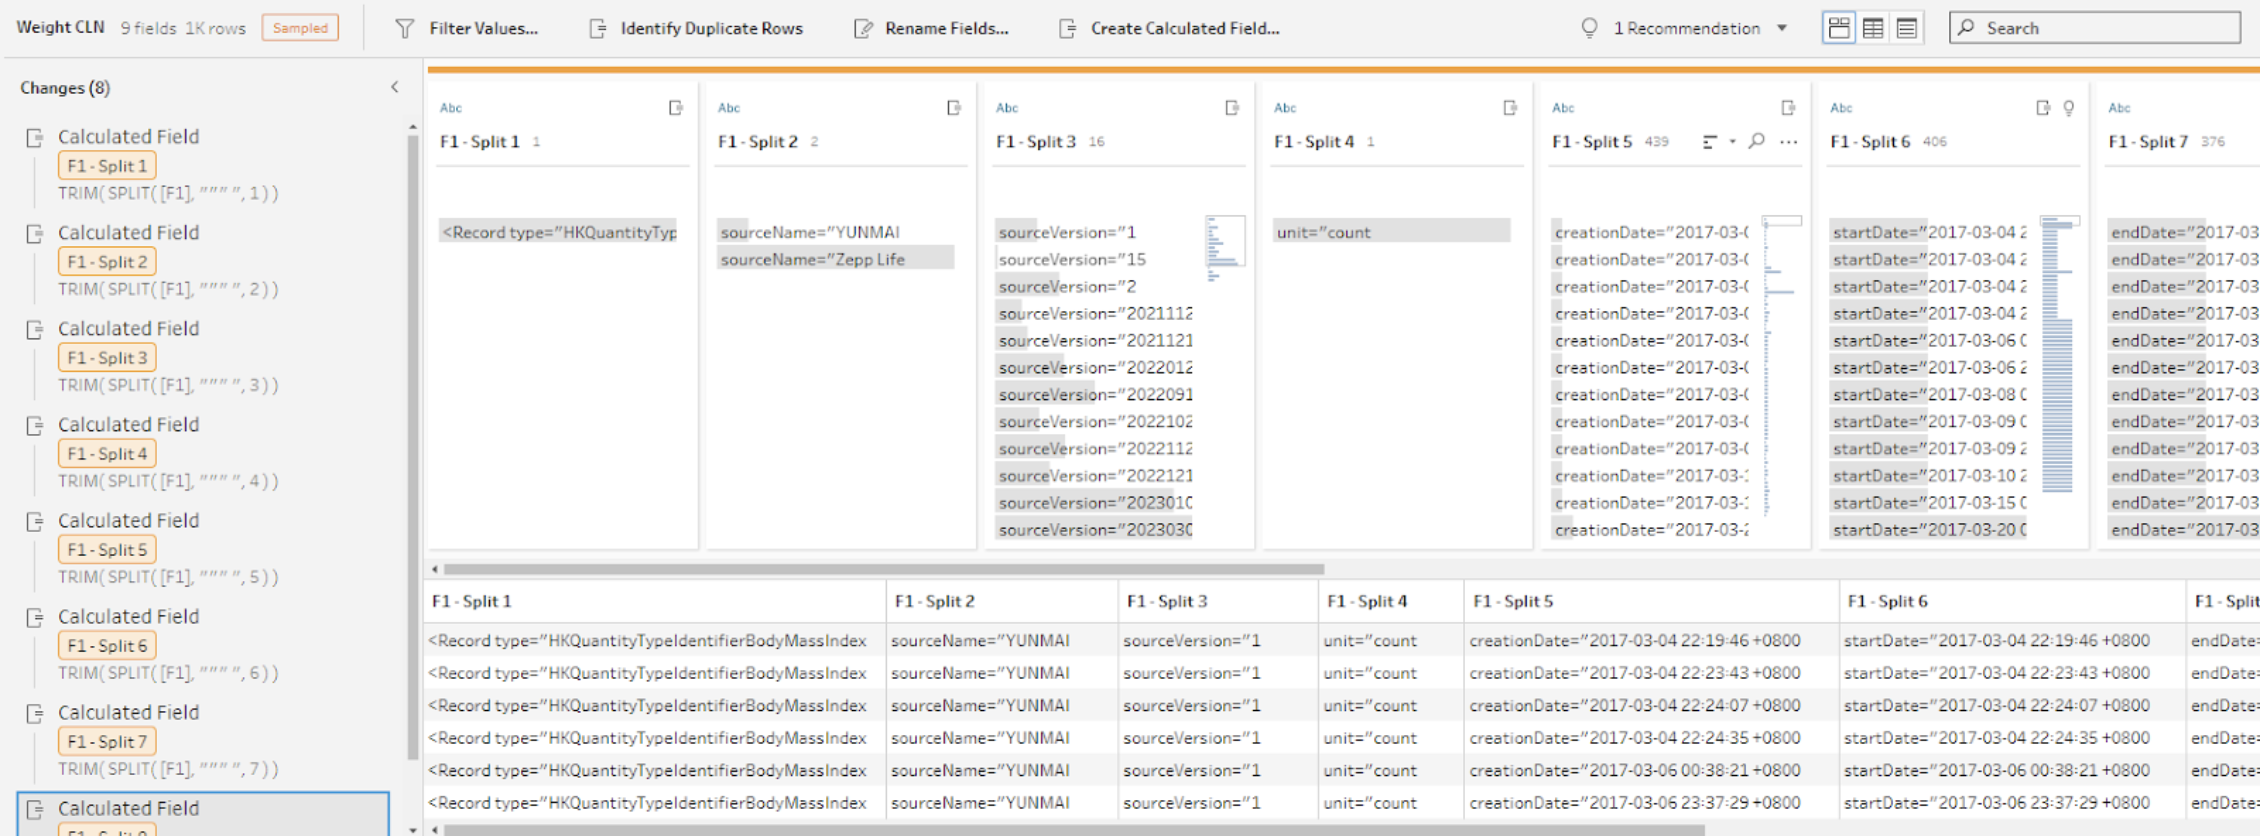
Here are some common ones I used:
- REPLACE([F1 - Split 1],'<Record type="HKQuantityTypeIdentifier','')
- REPLACE([F1 - Split 2],'sourceName="','')
- REPLACE([F1 - Split 5],'unit="','')
- REPLACE([F1 - Split 7],'startDate="','')
- REPLACE([F1 - Split 8],'endDate="','')
- REPLACE(REPLACE([F1 - Split 9],'value="',''),'"/>','')
Step 4: REGEX the Data Into Columns
However, after I got more familiarized with the data, I realized there were some rows with either missing deviceName or sourceVersion, due to incomplete data being pulled from external apps. I found a better way of doing it using REGEX. It does require a bit of a learning curve but fret not, I’ve done the homework so here are the formulas you need to create the calculated fields
|
Calculated Field |
Formula |
|
recordType |
REGEXP_EXTRACT( [F1], 'type="HKQuantityTypeIdentifier([^"]+)"') |
|
sourceName |
REGEXP_EXTRACT( [F1], 'sourceName="([^"]+)"') |
|
unitType |
REGEXP_EXTRACT( [F1], 'unit="([^"]+)"') |
|
startDate |
REGEXP_EXTRACT( [F1], 'startDate="([^"]+)"') |
|
endDate |
REGEXP_EXTRACT( [F1], 'endDate="([^"]+)"') |
|
metricValue |
REGEXP_EXTRACT( [F1], ’'value="([^"]+)"') |
And if you used the REGEX method, you really only need to remove the original F1 columns. Easy peasy right? (You can entirely ignore the Step 3A above if you’re using REGEX)
Step 5: Union and Output
After you are done with each activity, you can simply union all of them and add an Output step. There are two unions because there’s a limited number of sources you can add per union. Nothing special, just a workaround.
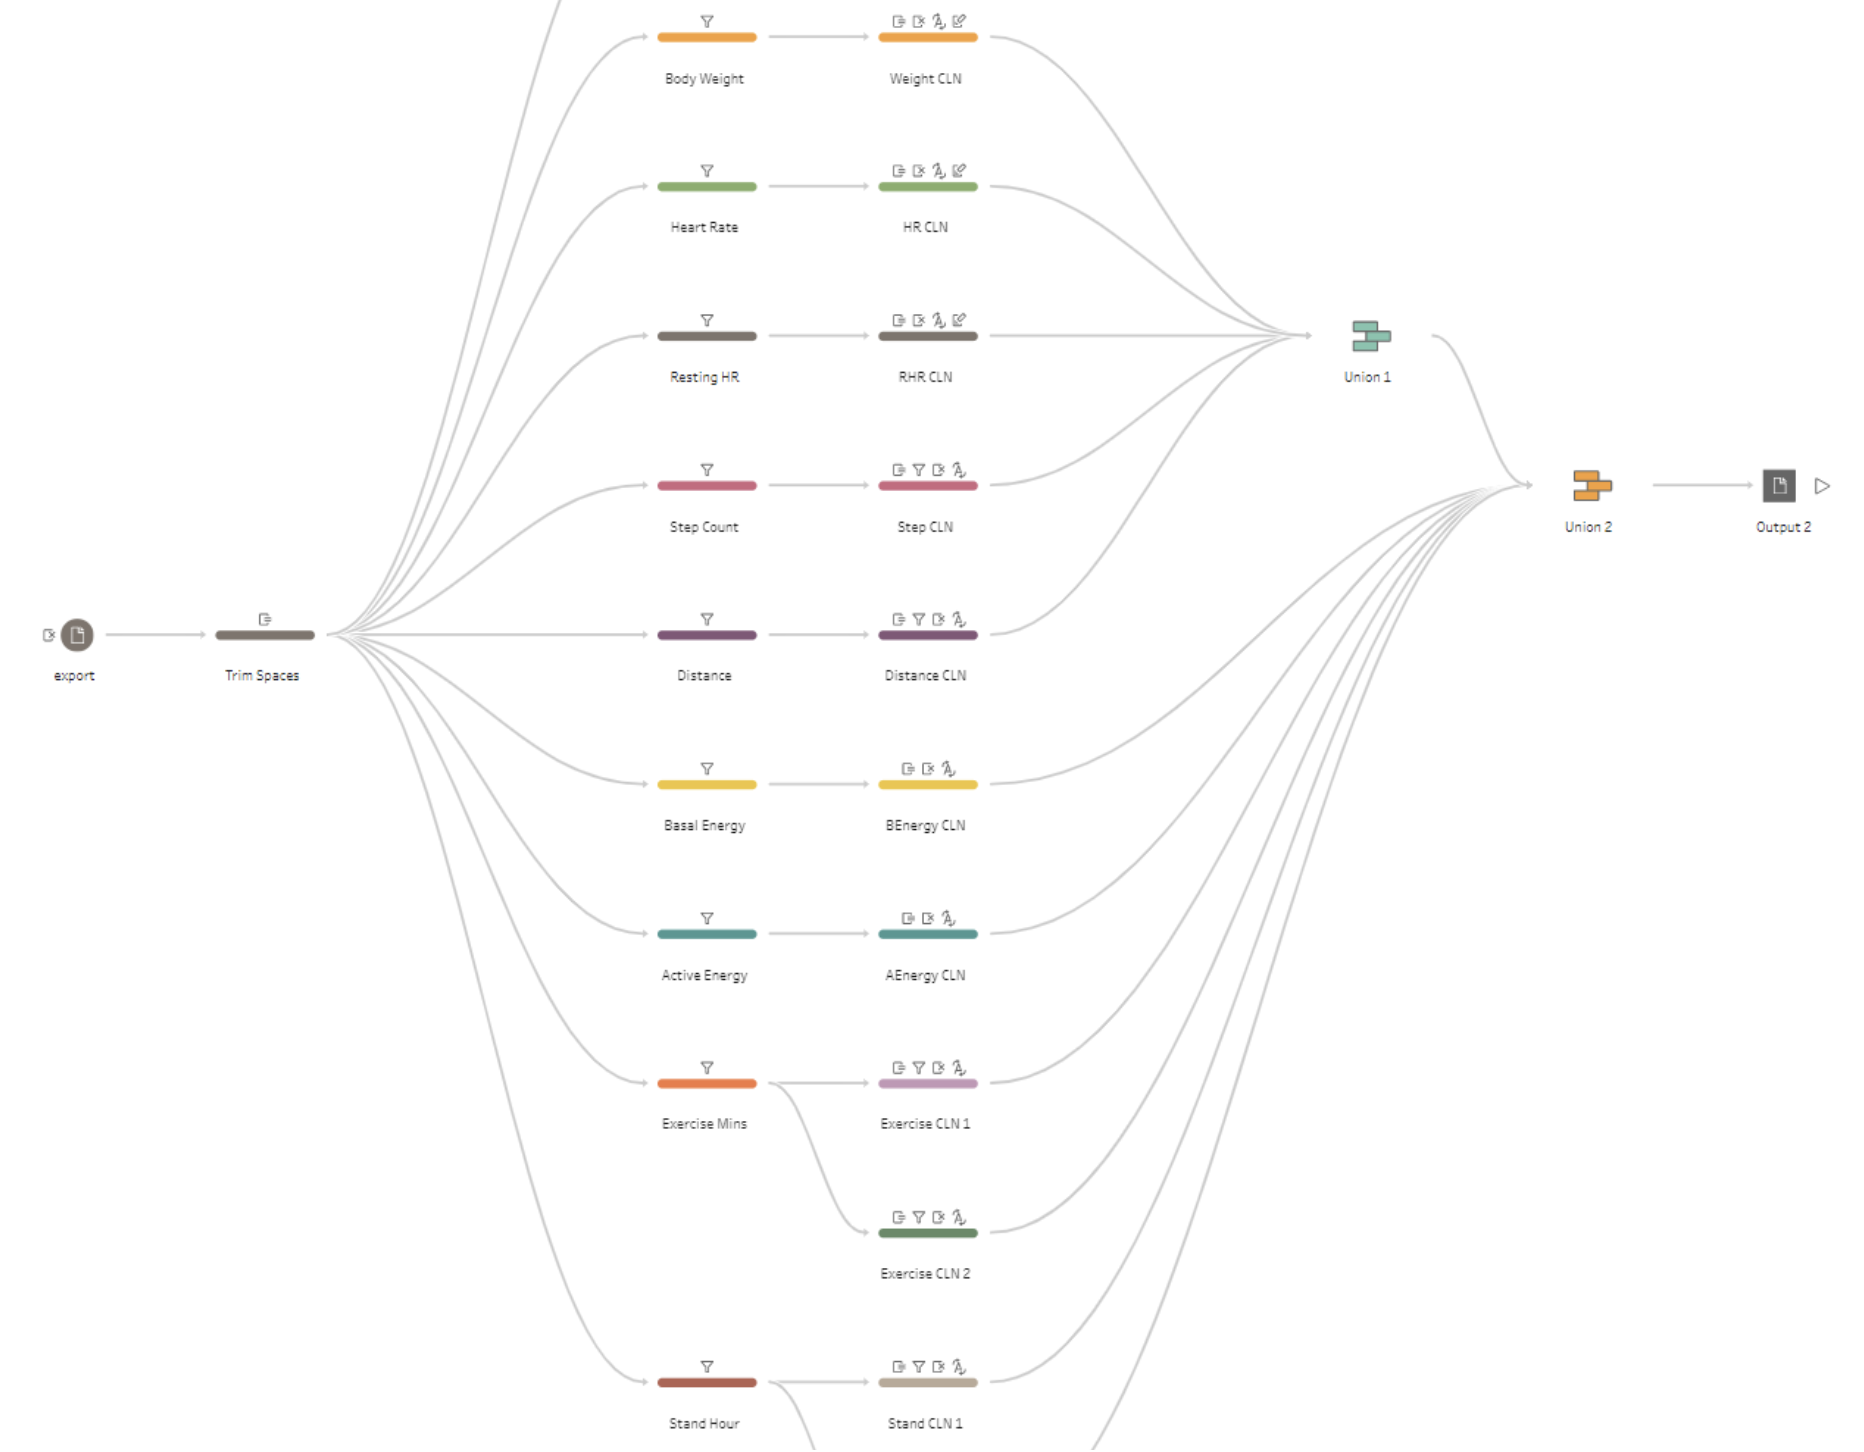
You can find the entire Tableau Prep workflow here to help you get started.
Now, you are ready to explore your own personal data in Tableau! What stories will you discover about yourself? Maybe it’s similar to my journey—or wildly different.
What I have learned from the entire process is that the best fitness regime is the one you can consistently commit to and make small attainable changes each day.
That’s very much like how we practice data analysis and visualization, isn’t it?
Connect with me on Tableau Public, LinkedIn, X and YouTube.
Stay up to date with the Tableau Community Project I co-run, Games Night Viz.
Historias relacionadas
Suscribirse a nuestro blog
Obtén las últimas actualizaciones de Tableau en tu bandeja de entrada.


