DataFam Roundup: October 23–27, 2023
Welcome! Dig into this week's DataFam Roundup—a weekly blog that brings together community content all in one post. As always, we invite you to send us your content—and the DataFam content from your peers that have inspired you! Find the content submission form here.
Community Highlight
To recognize new and consistent Tableau contributors—we’re excited to have a section within the weekly DataFam Roundup called the Tableau Community Highlight. Find out how to get involved.
Ben Norland, Lead Insights Strategist at Indeed
County Dublin, Ireland
Ben Norland is a Lead Insights Strategist at Indeed. He stays involved in the community by sharing his knowledge via X and Tableau Public and participating in community projects such as Sports Viz Sunday, Makeover Monday, and Iron Quest.
About three years ago, Ben was introduced to Tableau through work and now, though he uses it professionally everyday, he also produces personal visualizations on Tableau Public in order to explore new chart types and design styles.
Ben set a goal to publish 25 vizzes on Tableau Public this year and recently published his 21st. Through this personal challenge, Ben created his Shared Storylines in Modern Family viz, one of his favorites due to the technical complexity of the chord chart. Ben’s inspiration for the vizzes he builds comes from the work of others as well as events around him, particularly sports. Watching a game or documentary and questioning if the data supports the narrative, or if there’s a story in the data that hasn’t been recognized yet drives Ben to investigate further with Tableau.
Connect with Ben on Linkedin, X, and Tableau Public.
DataFam content
Dive into content created by the Tableau Community:

- Tina Covelli, Will Sutton, Louis Yu: #GamesNightViz The IronViz 3-hit Combo!
- Daria Kirilenko, DSCOVR Analytics: Bulk Renaming in Tableau Desktop
- Joshua Tapley: #tableau #excel #nocode
-
Kevin Flerlage, The Flerlage Twins: Ten Tips & Techniques Including the Easy Way to Clear All Filters (Round 7)
-
Donabel Santos, sqlbelle: Tableau Quick Tip - SUM vs WINDOW_SUM vs TOTA
-
Dawn Harrington, Tech Tips Girl: Before and After Dashboards
-
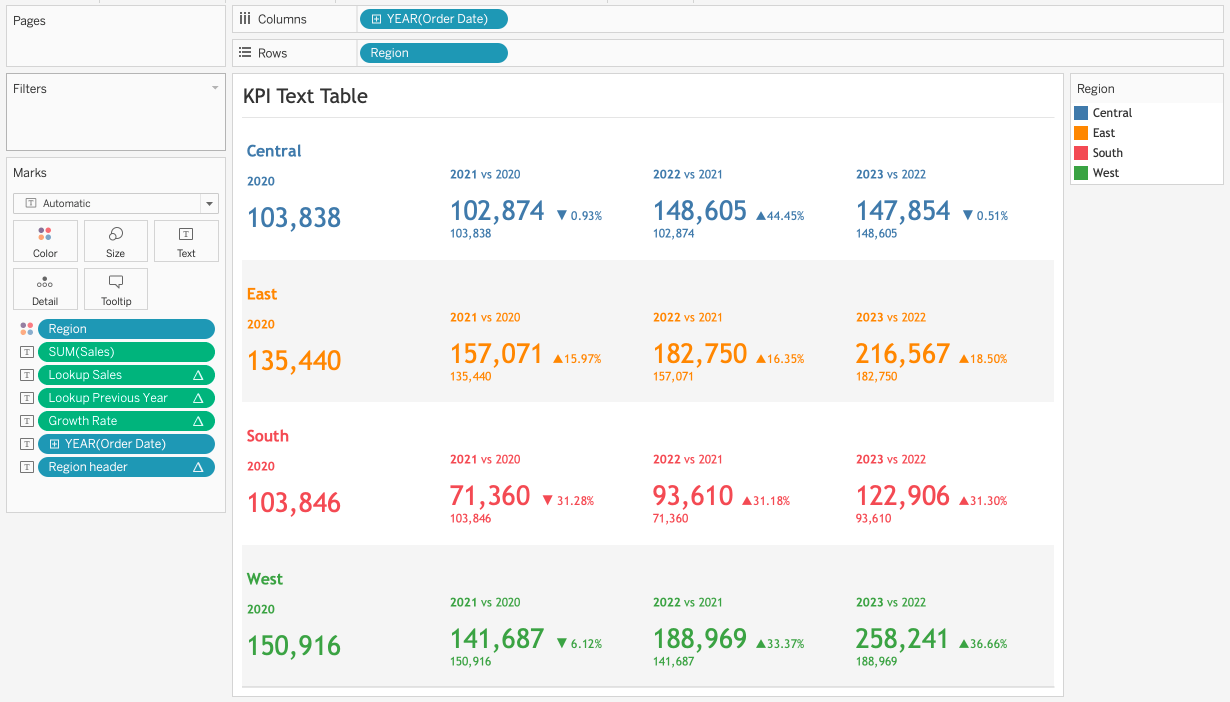
Prasann Prem: Using the Lookup function to craft a multiple KPI text table
-
Rosario Gauna: Drill Down in Sales Analysis
-
Tim Ngwena, TableauTim: Stratified Sampling in Tableau Prep | New in tableau 2023.3
Team Tableau
- 7 Ways to Stand Out and Secure Your Next Data Analytics Role
- 2024 Iron Viz Qualifiers Kickoff Recording
Upcoming events and community participation
-
The 2024 Iron Viz Qualifiers are now open! For the Qualifier contest, show us that data is in the air and submit a viz for this year’s theme of love. Viz about something that you’re passionate about—health and wellbeing, a musical group, a hobby, your friends or family—anything that makes your heart full. The Qualifier contest will run from October 2 - 31, 2023. It's an opportunity to challenge yourself, learn something new, and engage with an incredible community. Get recognized on a global stage. Win up to $15,000 in cash prizes for yourself and donate to a nonprofit while you’re at it.
-
Demystifying the way to learn Data Visualization! Are you looking for a way to learn Data Visualization and feeling lost? We all have been there and I am going to help you understand the fundamentals and look for a way to learn data visualization.
-
Viz Collab: Hello everyone! I’m excited to be opening #VizCollab back up for another round of matches! In the last year I matched around 40 people for some amazing vizzes, including Viz of the Days and a viz that was featured in a local publication. So if you want to find a collaboration partner sign up.
-
Local Community Conferences by the DataFam, for the DataFam.
Vizzes
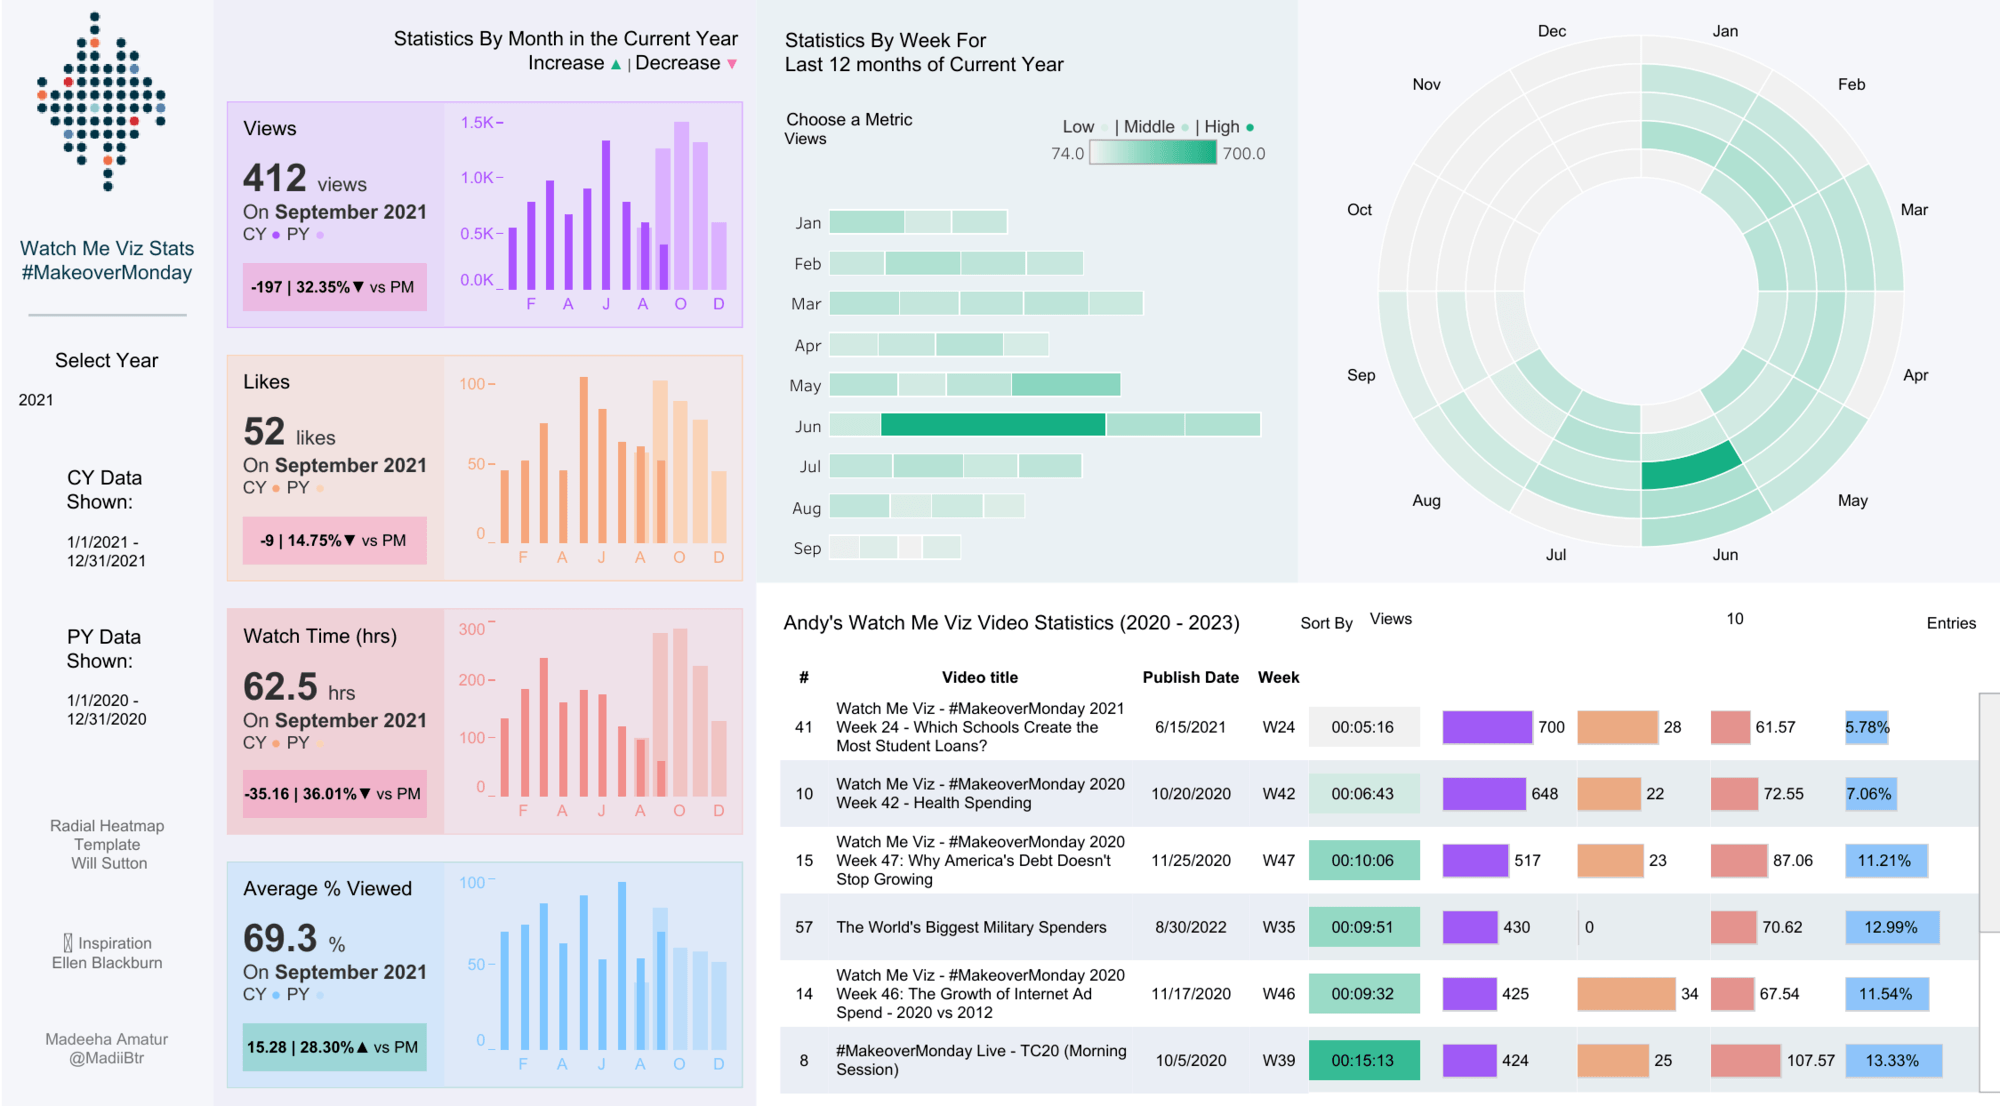
Madeeha Amatur: Watch Me Viz Stats | Makeover Monday
See the latest Viz of the Day, trending vizzes, featured authors, and more on Tableau Public.
Check out some inspirational vizzes created by the community:
-
Tobi Williams Babatunde: Impact of Farmer - Herder Conflicts in Benue State
-
Donny Brown: Tableau Exam Cram 360
-
Brittany Rosenau: How Many Vizzes Does It Take to Win Iron Viz?
-
David Rudkin: Hills of England
-
Madeeha Amatur: Watch Me Viz Stats | Makeover Monday
-
Prasann Prem: Sales Analysis Dashboard
-
Shaheen Arshiya: Breast Cancer and the decline of Mammogram Screenings during Covid-19 Pandemic
Community Projects
Back 2 Viz Basics
A bi-weekly project helping those who are newer in the community and just starting out with Tableau. Not limited just to newbies!
Web: Back 2 Viz Basics
Twitter: #B2VB
Skip week: Iron Viz
Workout Wednesday
Build your skills with a weekly challenge to re-create an interactive data visualization.
Web: Workout Wednesday
Twitter: #WOW2022
Week 43: Can you build a dynamic small multiple?
Makeover Monday
A weekly social data project.
Web: Makeover Monday
Twitter: #MakeoverMonday
Preppin' Data
A weekly challenge to help you learn to prepare data and use Tableau Prep.
Web: Preppin’ Data
Twitter: #PreppinData
Week 43: Best Attendance Awards
DataFam Con
A monthly challenge covering pop culture and fandoms.
Web: DataFam Con
Twitter: #DataFamCon
September 2023: Barbie World!
EduVizzers
A monthly project connecting real education data with real people.
Web: Eduvizzers
September 2023: School Book Bans in the United States
Games Night Viz
A monthly project focusing on using data from your favorite games.
Web: Games Nights Viz
Twitter: #GamesNightViz
Season 2: Battle of the Strongest
Iron Quest
Practice data sourcing, preparation, and visualization skills in a themed monthly challenge.
Web: Iron Quest
Twitter: #IronQuest
White Space
Storytelling with Data
Practice data visualization and storytelling skills by participating in monthly challenges and exercises.
Web: Storytelling with Data
Twitter: #SWDChallenge
September 2023: makeover magic
Project Health Viz
Uncover new stories by visualizing healthcare data sets provided each month.
Web: Project Health Viz
Twitter: #ProjectHealthViz
June 2023: Funding for Research for Various Conditions and Diseases
Diversity in Data
An initiative centered around diversity, equity & awareness by visualizing provided datasets each month.
Web: Diversity in Data
Twitter: #DiversityinData
May 2023: Mental Health Awareness Month and LGBTQ+ Representation in film
Sports Viz Sunday
Create and share data visualizations using rich, sports-themed data sets in a monthly challenge.
Web: Sports Viz Sunday
Twitter: #SportsVizSunday
Viz for Social Good
Volunteer to design data visualizations that help nonprofits harness the power of data for social change.
Web: Viz for Social Good
Twitter: #VizforSocialGood
Real World Fake Data
Create business dashboards using provided data sets for various industries and departments.
Web: Real World Fake Data
Twitter: #RWFD
Session 5: Diversity Score Card
Data Plus Music
A monthly project visualizing the data behind the music we love!
Web: Data Plus Music
Twitter: #DataPlusMusic
Historias relacionadas
Suscribirse a nuestro blog
Obtén las últimas actualizaciones de Tableau en tu bandeja de entrada.


