DataFam Roundup: June 10–14, 2024
Welcome! Dig into this week's DataFam Roundup—a weekly blog that brings together community content all in one post. As always, we invite you to send us your content—and the DataFam content from your peers that have inspired you! Find the content submission form here.
Community Highlight
To recognize new and consistent Tableau contributors—we’re excited to have a section within the weekly DataFam Roundup called the Tableau Community Highlight. Find out how to get involved.

Kate Strachnyi, Founder of DATAcated
New York, USA
Kate got started with Tableau through a transition to a role as an insights strategy manager and was immediately inspired, causing a deep dive into the data visualization world. She initially got Tableau experience through hands-on challenges such as Makeover Monday and recreating dashboards but eventually launched her own YouTube channel, DATAcated, to share what she has learned and the essentials of becoming a successful data scientist.
DATAcated has now evolved to a media company that collaborates with data analytics, AI, and machine learning companies to enhance brand awareness and amplify content on social media platforms like LinkedIn and YouTube. Recently, Kate has focused on spreading brand awareness through discussions, such as her interview with Southard Jones, Tableau's Chief Product Officer, which was highlighted in a recap article about the latest Tableau Conference.
Connect with Kate on Linkedin, X, Tableau Public, on her blog, and on her YouTube channel.
DataFam content
Dive into content created by the Tableau Community:

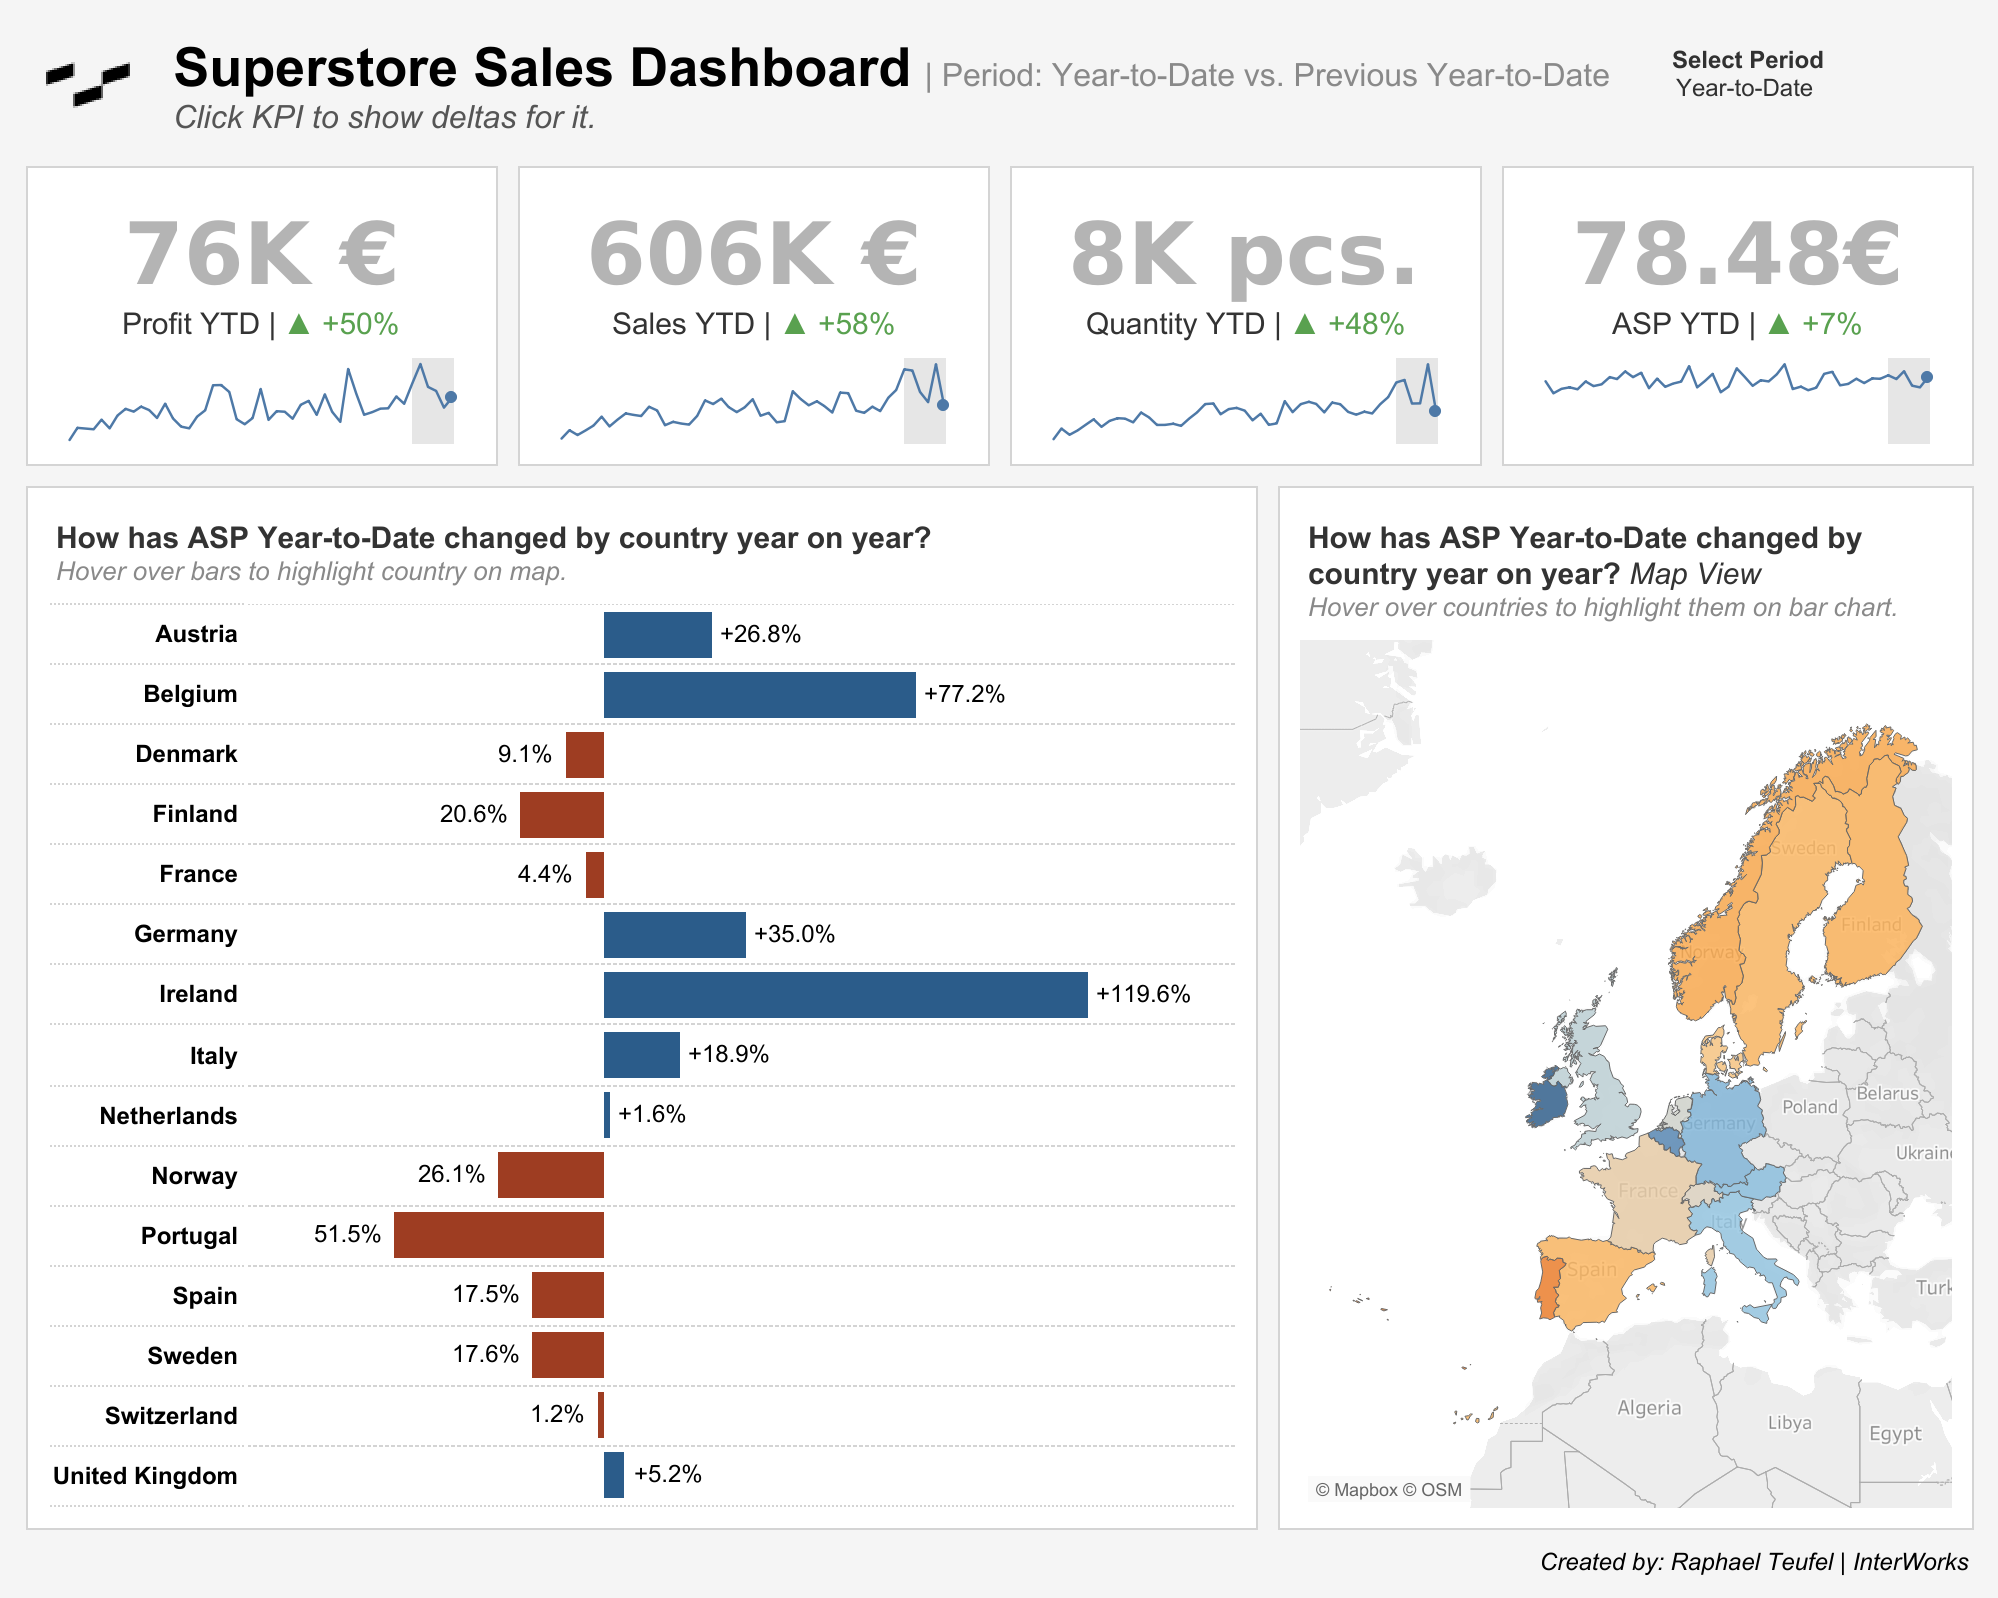
Raphael Teufel: The Ultimate Guide to Year-over-Year Comparisons in Tableau
- Michael Sandberg: Tableau Tip #1 – Why some things look different on Tableau Server and how to fix it
- Anthony Smoak: Create a Stunning Advanced Dashboard in Tableau
- Prachi Priya, The Data Leadership Collaborative: 5 Things that Must Be in Place Before Launching Any Large-Scale AI Project
- Jim Dehner: Filter Set and Parameter Actions
- Lena Winfree, The Data Leadership Collaborative: Removing AI and Technology Adoption Obstacles in Education
- Raphael Teufel: The Ultimate Guide to Year-over-Year Comparisons in Tableau
- Brittany Rosenau: 5 Tiny Ideas to improve Tableau Public
- Louis Yu: Secrets of the Viz: Celebrating Pride Month
- Chris Westlake: Iron Viz | A Spotlight on Analysis
- The Flerlage Twins: 400th Blog: A Brief History of the Flerlage Twins
- Sarah Pallett: #B2VB Challenge: HBCU College Finder Text Table
- Dawn Harrington, Tech Tips Girl: When Would You Use a Dot Strip Plot?
Team Tableau
- Tableau Ambassador nominations and applications are open
- Tableau Public Featured Authors: June 2024
- What can you learn from attending the Tableau Public User Group?
Upcoming events and community participation
- Lights, Camera, Action: Tableau and IMDb Launch Data Visualization Campaign for Movie Lovers
- DataFam Birthday Roundup! In the effort of continuing support for one another, we thought it would be fun to gather data on DataFam birthdays! If you're willing, could you let us know which day you celebrate your birthday? Just go ahead and pick the day from this year's calendar, since it's a leap year and all possible days are available to choose from!
- Mentorship Program by the Data Visualization Society
- Women in Dataviz Virtual Coffee Breaks: Held every sixth Thursday morning and every sixth Wednesday afternoon in the EST time zone, Virtual Coffee Breaks are a casual networking event. Feel free to drop in and out as you need toduring the hour, and stay for as little time or as long as you want.
- First-ever CRM Analytics Q&A Session: Join us for an engaging discussion and valuable insights into CRM Analytics!
Vizzes

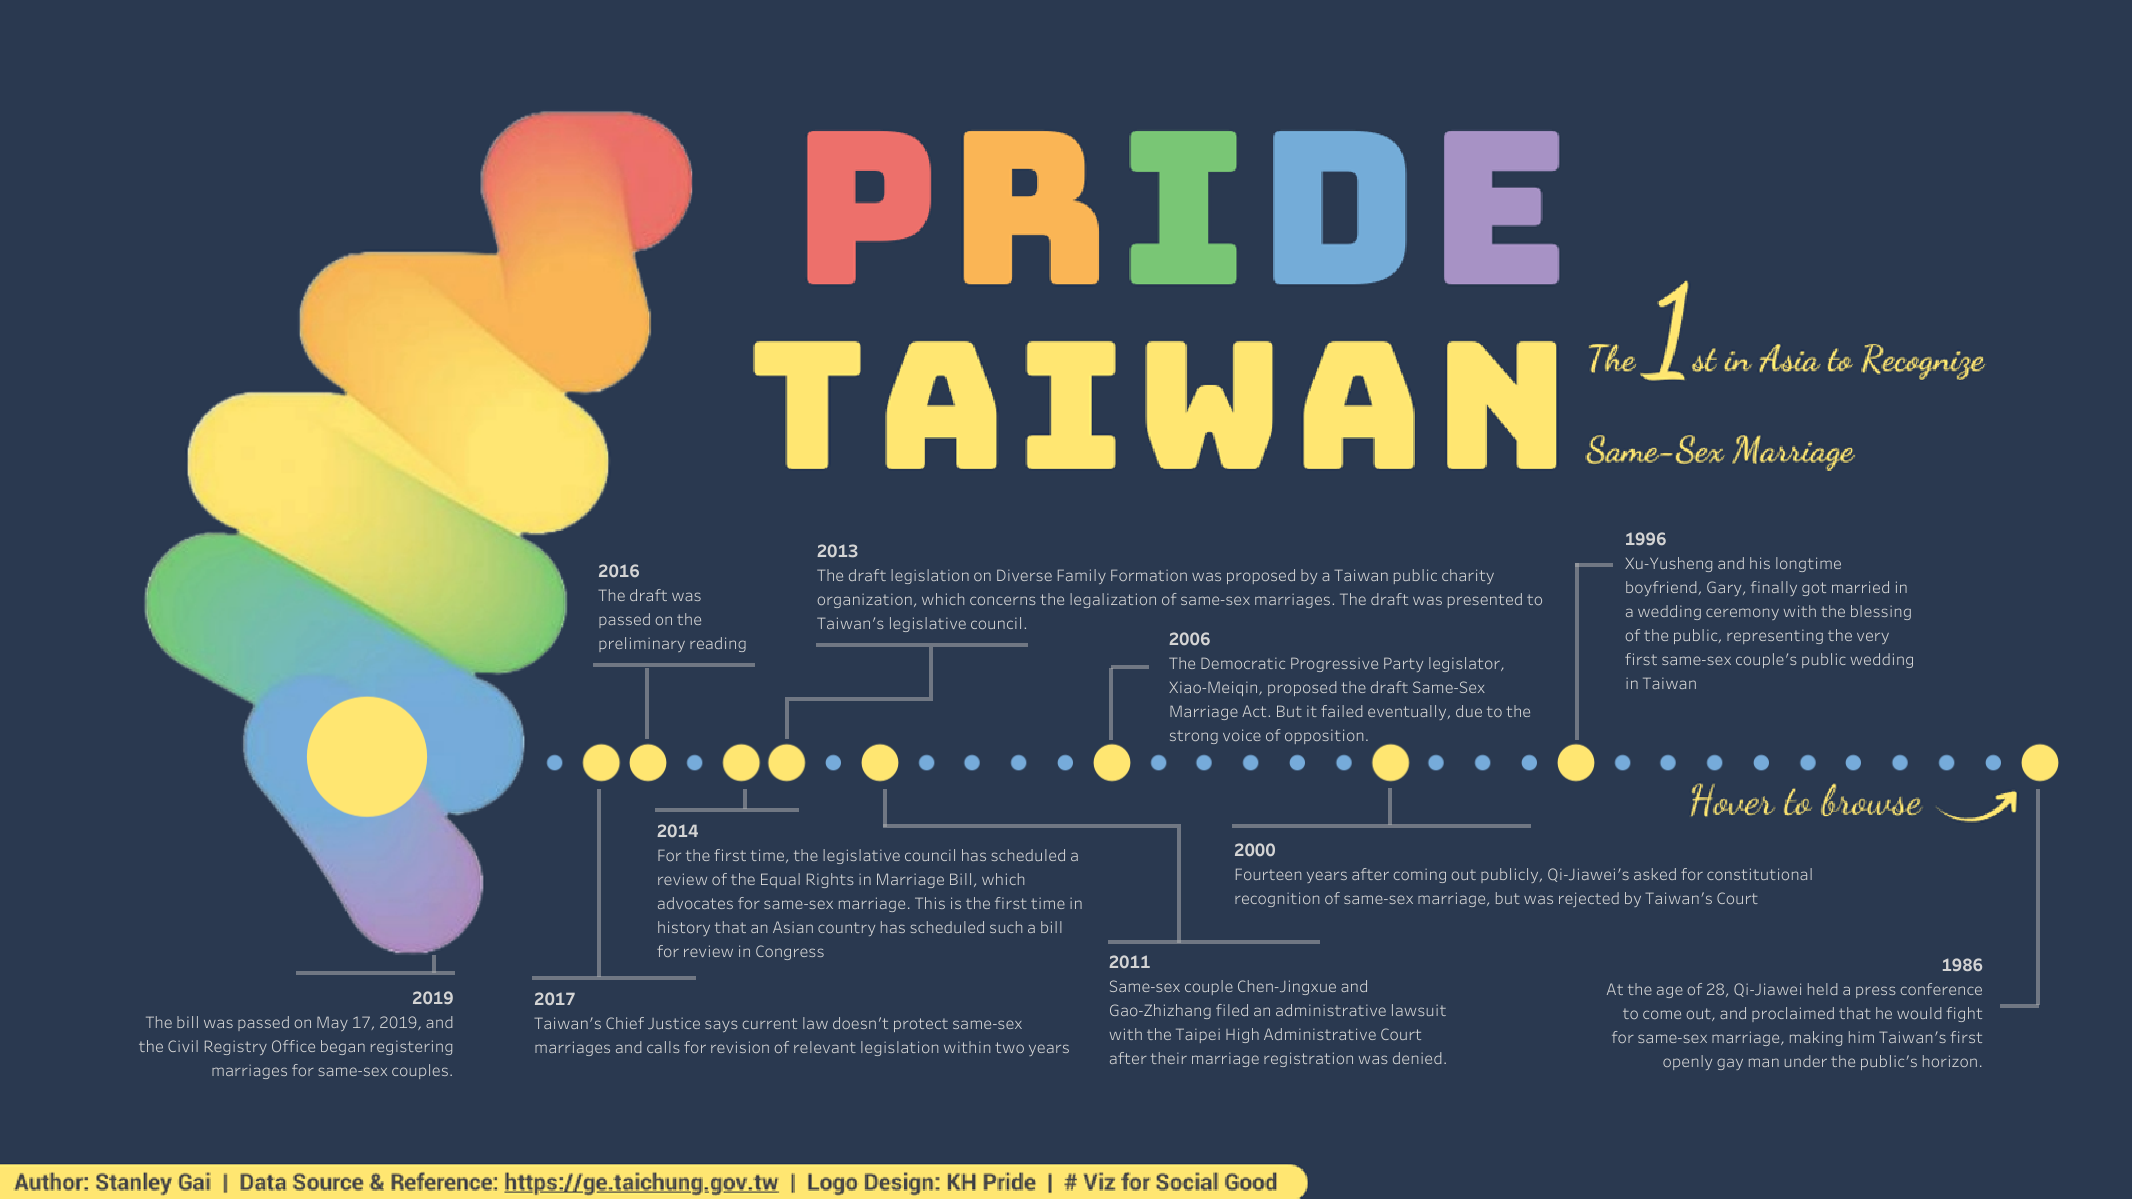
Stanley Gai: Data Pride- A Look at Taiwan
See the latest Viz of the Day, trending vizzes, featured authors, and more on Tableau Public.
Check out some inspirational vizzes created by the community:
- Yuri Fal: XmR_YF
- Stanley Gai: Data Pride- A Look at Taiwan
- Ryan Soares: Euro 2024 Squads
- Lisa Trescott: Hosts of The Gay Games
- Dennis Kao: The Gay Games
- Rob Taylor: The Dead Heat!
- Chiaki Ishida: Is your perception of the global environment Positive or Negative? | Japan #VizGames Final 2024
- Frederic Fery: Sales Drivers and Customer Segments Analysis
- Wendy Shijia 汪士佳: 115 Moments in Ink
- Veronica Simoes, P A T H | We Are Data People: Missões Espaciais
Community Projects
Back 2 Viz Basics
A bi-weekly project helping those who are newer in the community and just starting out with Tableau. Not limited just to newbies!
Web: Back 2 Viz Basics
X: #B2VB
Week 12: Use Annotations Effectively
Workout Wednesday
Build your skills with a weekly challenge to re-create an interactive data visualization.
Web: Workout Wednesday
X: #WOW2022
Week 24: Can you visualise headcount distribution in multiple ways on a single sheet?
Preppin' Data
A weekly challenge to help you learn to prepare data and use Tableau Prep.
Web: Preppin’ Data
X: #PreppinData
Week 24: SuperBytes Salaries Part 2
Makeover Monday
Create business dashboards using provided data sets for various industries and departments.
Web: Makeover Monday
X: #MakeoverMonday
Week 24: What’s Going On in This Graph? | Engagement Ring Costs
DataFam Con
A monthly challenge covering pop culture and fandoms.
Web: DataFam Con
X: #DataFamCon
March 2024 Challenge: Sports Movies Edition
EduVizzers
A monthly project connecting real education data with real people.
Web: Eduvizzers
May 2024: Data + Movies + Education (IMDB)
Viz for Social Good
Volunteer to design data visualizations that help nonprofits harness the power of data for social change.
Web: Viz for Social Good
X: #VizforSocialGood
Games Night Viz
A monthly project focusing on using data from your favorite games.
Web: Games Nights Viz
X: #GamesNightViz
Season 2: Cooking up the Spice of Data
Iron Quest
Practice data sourcing, preparation, and visualization skills in a themed monthly challenge.
Web: Iron Quest
X: #IronQuest
Women
Storytelling with Data
Practice data visualization and storytelling skills by participating in monthly challenges and exercises.
Web: Storytelling with Data
X: #SWDChallenge
June 2024: make a funnel chart
Project Health Viz
Uncover new stories by visualizing healthcare data sets provided each month.
Web: Project Health Viz
X: #ProjectHealthViz
Diversity in Data
An initiative centered around diversity, equity & awareness by visualizing provided datasets each month.
Web: Diversity in Data
X: #DiversityinData
Sports Viz Sunday
Create and share data visualizations using rich, sports-themed data sets in a monthly challenge.
Web: Sports Viz Sunday
X: #SportsVizSunday
Real World Fake Data
Create business dashboards using provided data sets for various industries and departments.
Web: Real World Fake Data
X: #RWFD
2024 - Admin Insights
Data Plus Music
A monthly project visualizing the data behind the music we love!
Web: Data Plus Music
X: #DataPlusMusic
Historias relacionadas
Suscribirse a nuestro blog
Obtén las últimas actualizaciones de Tableau en tu bandeja de entrada.


