How to decide on the right mix of users for your organisation
Analytics tailored to your team
Now more than ever, people need access to data to do their jobs better. But their relationship to data can differ. This is why we’ve created different roles to match the different data needs of your people. These roles will allow you to share data with your teams in a secure way, while allowing for the differences in the way people interact with data.
Your organisation is full of people doing different things with data. Some use data to answer questions to drive their businesses forwards and to accomplish their team goals. Others prepare spreadsheets and reports that they send out to others in their company. Some ask deeper questions of their data, like “Well, it’s good to know that sales are up in the eastern region, but what’s driving that growth? How do we take what’s working there and bring it to other areas?” Meanwhile, others pull in raw data from software apps they use so they can see what’s really going on and grab quick snapshots of important KPIs to use during team meetings or to present to customers. Our new offerings are designed to meet the different needs of the people in your organisation.
From the Creators to the Explorers and Viewers, Tableau meets the varying needs of everyone and helps all of them do their jobs better.
So how do you decide how many Creators, Explorers and Viewers you’ll need?
That’s a good question, because it depends on your company as well as the skills and needs of those who work there. But every member of your team fits into one of these roles. Read through the descriptions below to see which one fits your team member best.
The Tableau Creators
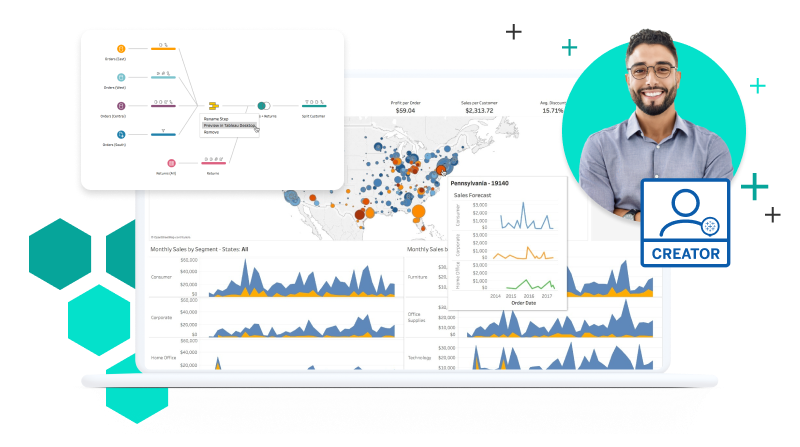
Creators are anyone in your organisation who connects to sources of data and crafts that data into something useful for themselves and others. In your organisation today, they likely create reports and distribute them through email or a share drive. They are performing ad-hoc analysis to answer deeper questions of their data. They are your data power users.
With Tableau, your Creators will pull meaning and purpose out of raw data. They will clean and prep their data to bring order to chaos. They will conduct complex analysis with style and speed, delivering delightful results. And they will publish their visualisations and data sources to their organisation, empowering others to do their jobs better than ever before. These team members need a powerful analytics platform to help them unlock their potential to discover transformative insights.
As the name implies, they are the team members who will create much of the content, data visualisations and data sources used by others on the Tableau Platform.
The Tableau Explorers
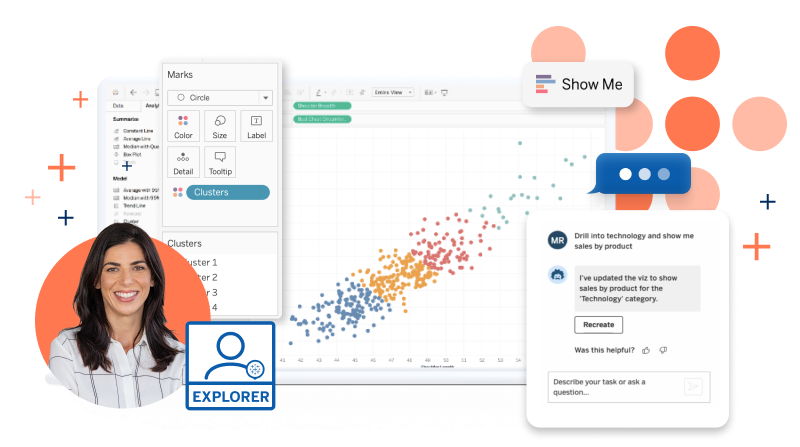
Explorers are your modern business users – your mobilising force for change. They may not have analyst in their title, but they’re comfortable with data. They’re looking to move their businesses forwards and need to probe deeper into the data to find answers to their own questions. These answers are often outside the confines of pre-built reports.
In your organisation today, they likely receive reports from others and combine them with different data points to tailor them to their needs. Pivot tables and vlookups are well known to them. Explorers want to ask and answer their own questions of data.
In Tableau, Explorers will be able to build new workbooks themselves using published data sources or start with existing workbooks and dashboards, all through their browser or mobile device. But they won’t stop there. They’ll ask and answer deeper questions that may not have been answered in the initial round of reporting. Your team will explore their data and stay in the analytical flow like never before.
The Tableau Viewers
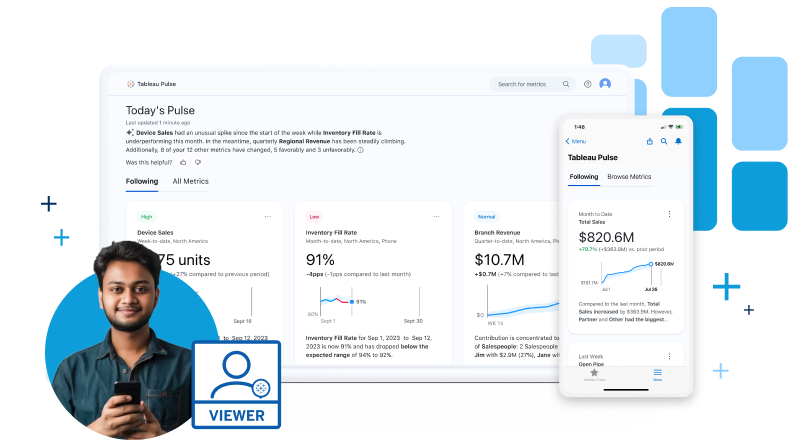
Viewers use data to inform and improve the decisions they make. Tableau Viewers can be anyone from team members who need data to perform many of their daily tasks, to people managers who need to see how their teams are progressing on important projects, to the CEO who needs high-level metrics about the health of the business.
Tableau Viewer is the Tableau role that helps you scale analytics to all corners of your organization. Tomorrow your Viewers will use the Tableau Platform to back up their intuition with facts and make data-driven decisions based on dashboards built by your Creators and Explorers. Viewers can interact with the dashboards and data visualisations to inform their decisions and put data at the centre of every business conversation. With augmented capabililities, Viewers can also perform light analysis on their own by asking follow-up questions in a dashboard using natural language and leveraging automatic explanations to understand the drivers behind a specific value. Using Tableau dashboards and workbooks across your company will standardize the way your teams interact with data while protecting the integrity of your data.
Ready to choose?
Speak with a member of our sales team to find the right mix for you.
Additional factors to consider
How is data used within your organisation?
Organisations both large and small use data to drive their businesses forwards and solve important business problems. But how they use data can differ significantly from company to company or team to team. Some companies silo data analytics by team function and they lack a common structure across the company. Others use data widely and it’s central to every substantive decision. It’s important to assess your current data maturity level when choosing your deployment.
Reminder: When evaluating the best mix of roles for your team, remember to consider both your team’s current relationship with data today, and also how you would like your organisation to interact with and question the data at your disposal in the future.
How big do you want to go out of the gate?
The more people in your organisation accessing relevant data, the better their decisions will be. But for many companies, access to data is a difficult journey. For organisations that want to start small and grow over time, it’s best to start with higher percentages of Creators and Explorers. These initial users will build up a healthy base of content as you start to add increasing numbers of Viewers.
We’ve seen that the more your team are exposed to the power of data, the more they want to ask and answer their own questions. Therefore, Viewers will begin to naturally move into the Explorer and even Creator user groups as time progresses.
Some more questions to help assess your team's needs
One way to help with this decision is to think about your team's’ current interactions with data and analysis tools. Ask yourself these questions:
- How many employees currently use MS Excel or other spreadsheets for data preparation or analysis?
- How many employees do you have with analyst in their titles?
- How many of your team members send spreadsheets out to distribution lists or upload them to share drives for others to consume?
- How many team members receive these spreadsheets and use them to inform their decisions or do their jobs?
- What kinds of analytical tasks do your team currently perform or would they like to perform?
- Do they work directly with data to create analytical content?
- Do they collaborate with others around data?
- Do they receive monthly reports with data created by others?
- What kind of derivative content is produced from emailed reports?