Use Parameters to Add Multiple Views to Your Viz
One of the things I like most about using Tableau is experimenting with different types of visualizations. But what if the people who are using my viz want to be able to switch between different types of charts and graphs as well? Here are several different ways of accomplishing that.

One of the things I like most about using Tableau is experimenting with different types of visualizations. But what if the people who are viewing my dashboard want to be able to switch between different types of charts and graphs as well? Here are several different ways of accomplishing that.
1. Switching between a Bar Chart and a Line Chart
This is a fairly simple trick that is detailed much more eloquently by Andy Kriebel here. Create a parameter that has two options, either a bar chart or a line chart. Then create two calculated fields, one for each value. They are the same calculated field, but the beginning is a little different for each one. The bar chart option reads "if[Parameter]="Bar" then [Profit] else null end". The line chart option reads "if[Parameter]="Line" then [Profit] else null end.
To finish the job, place these together as a dual axis chart, then make sure to select a "Line" visualization type for the Line calculation on the Marks card. Since each of the calculated fields will have a null value when the parameter is on the other choice, one of them will always be null. For the finishing touch, synchronize axes.
2. Showing Sub-Category on Demand
If an end user wants to drill into a hierarchy with many values in Tableau, the query can create a visualization that is too large to view in one viz. This trick makes it possible to drill into a secondary dimension, but only on selected values.
First create a parameter that has the values of the first level category or dimension in your hierarchy. Then create a very simple calculated field to replace your second level category/dimension: "if[Parameter]=[Category] then [Sub-Category] else "" end".
After replacing the original sub-category field on the view with the new calculated field, only the selected input category will show sub-category.3. Switching between Different Visualizations on a Dashboard
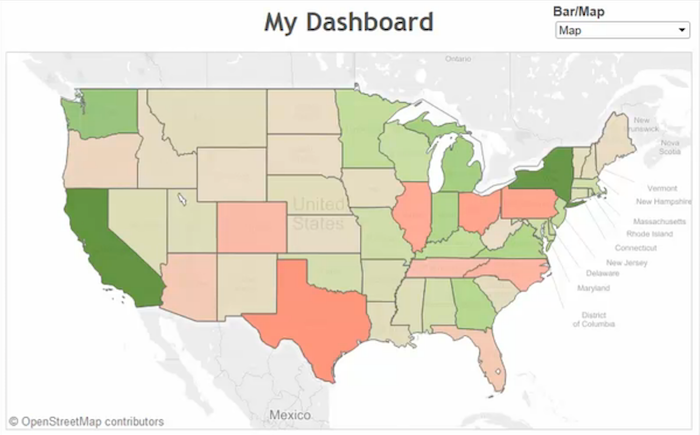
What if my colleague wants to switch between a map and a bar chart on a dashboard? Well, the endlessly innovative Alan Smithee found a great way of doing just that. Simply create a parameter that has the input of either a bar chart or a map. Then create a calculated field to filter out whichever view isn't selected in the parameter—something like: "if[Parameter]="Bar" then 1 else 0". Then repeat the opposite for the second visualization, and filter on each view so that only values of 1 are visible.
Now add each visualization to a dashboard container, hide the titles, and make sure the parameter is available. Switching between views becomes just a flick of a switch.
Here's a more detailed explanation of the tips:
Subscribe to our blog
Ontvang de nieuwste updates van Tableau in je inbox.


